2026 4

The Curator's Dilemma - VizChitra 2026

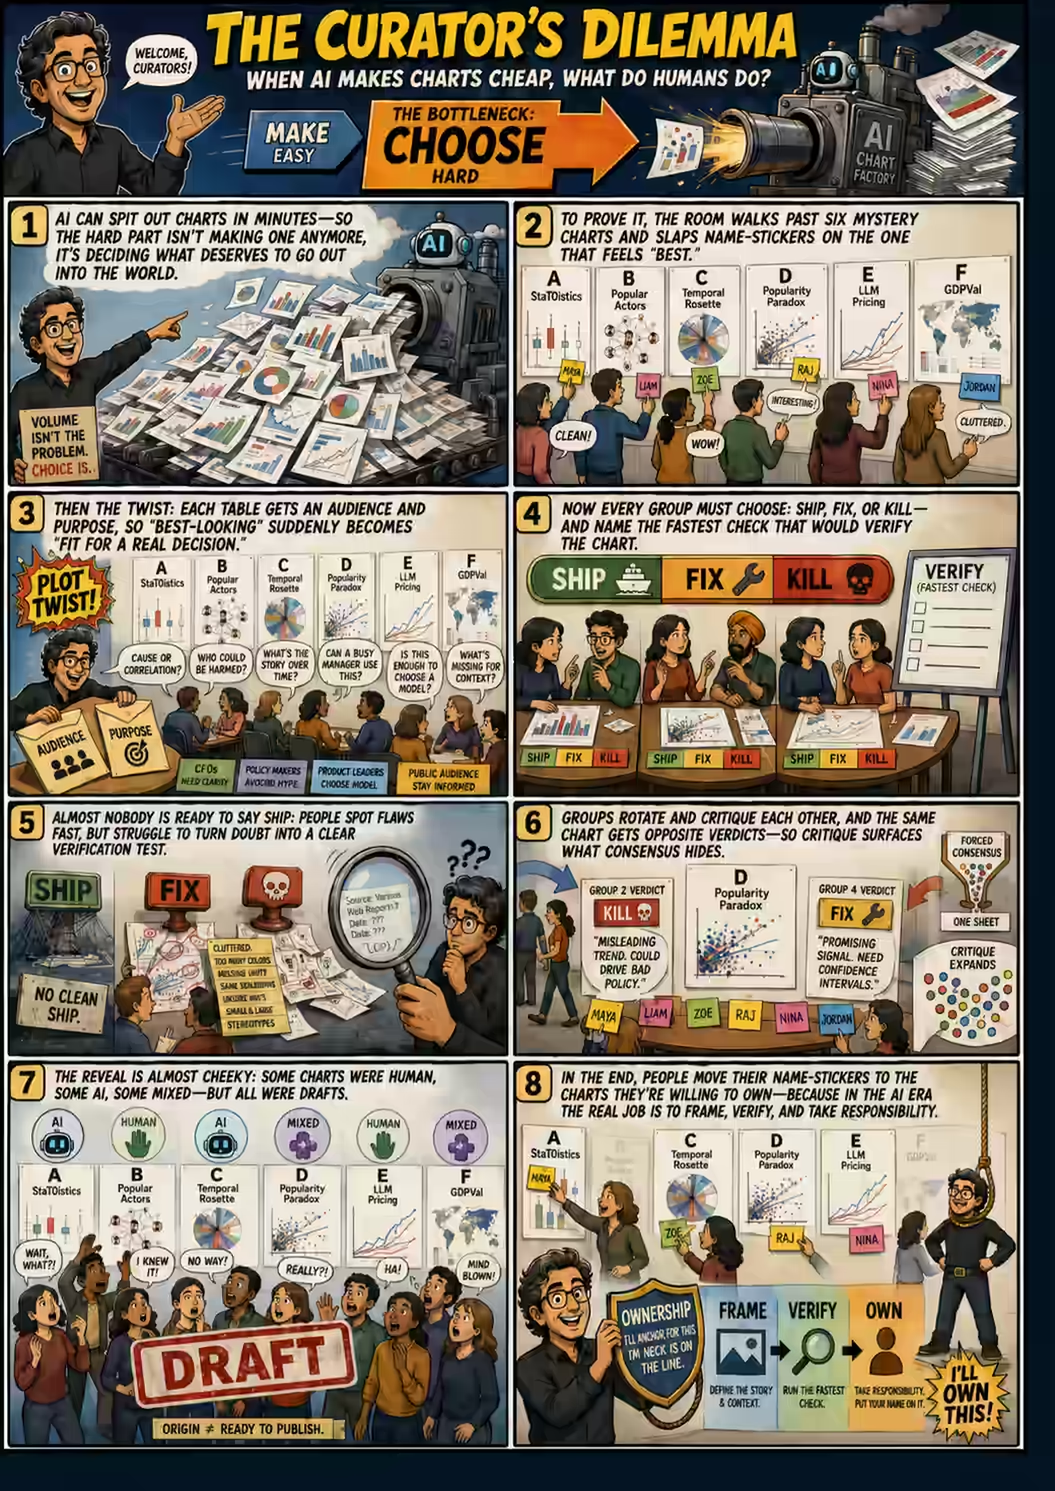
Last week at VizChitra, I ran a “Dialogue” session. A new format for me. I usually speak 80% in my workshops. In this dialog, I spoke 20%. The group discussed. PART A I showed 6 charts and said, “Pick the best.” Then I shared the audience & purpose and asked: “For THIS audience and purpose, will you publish, fix, or kill it?” INSIGHT: almost no one said, “Ship”. That’s good – these were all drafts. ...

Arvind Satyanarayan talk at VizChitra 2026

On Sat 4 July at Bangalore, Arvind Satyanarayan is speaking at VizChitra 2026 - a talk I’m keenly looking forward to. I’ve been following Arvind’s work since Vega-Lite. It’s a grammar of graphics - something that makes data visualizations (charts) more structured. I tried switching to it our default at Gramener - but most felt it was too much to learn (they already knew Excel/Power BI) or too limiting (D3 can do more). ...

Submitting an AI-ded VizChitra Proposal

10:20 am. After submitting my VizChitra 2026 talk proposal, did a quick analysis of the submissions. Copy the HTML from the submissions page and paste into Gemini. Ask it: “Given this HTML, share a JS snippet I can copy and paste into DevTools that will return an array of objects containing all the useful information about each submission.” Paste the JS snippet into DevTools and get the structured result. Here’s the breakdown of submissions (excluding exchibitions): ...

Can AI discover new data visualizations?

Here’s my talk proposal for VizChitra 2026: Description There’s stuff I know AI can do. Create data visualizations. I just tell it to convert a dataset into a treemap, and it does. Hallucinate. That’s a fancy word for “make stuff up”. I prefer calling it “creativity”. Run forever. As long as I have token budget and can summarize the context, it can go on. What if we combine these? What if we asked it to do research? If infinite monkeys will almost surely produce Shakespeare, how long will it take for the greatest AI to discover a truly novel data visualization that is useful? ...

2025 3

We created data visualizations just using LLMs at my VizChitra workshop yesterday. Titled Prompt to Plot, it covered: Finding a dataset Ideating what to do with it Analyzing the data Visualizing the data Publishing it on GitHub … using only LLM tools like #ChatGPT, #Claude, #Jules, #Codex, etc. with zero manual coding, analysis, or story writing. Here’re 6 stories completed during the 3-hour workshop: Spotify Data Stories: https://rishabhmakes.github.io/llm-dataviz/ The Price of Perfection: https://coffee-reviews.prayashm.com/ The Anatomy of Unrest: https://story-b0f1c.web.app/ The Page Turner’s Paradox: https://devanshikat.github.io/BooksVis/ Do Readers Love Long Books? https://nchandrasekharr.github.io/booksviz/ Books Viz: https://rasagy.in/books-viz/ The material is online. Try it! ...

My VizChitra talk on Data Design by Dialog was on LLMs helping in every stage of data storytelling. Main takeaways: After open data, LLMs may the single biggest act of data democratization. https://youtu.be/hPH5_ulHtno?t=01m24s LLMs can help in every step of the (data) value chain. https://youtu.be/hPH5_ulHtno?t=00m47s LLMs are bad with numbers. Have them write code instead. https://youtu.be/hPH5_ulHtno?t=06m33s Don’t confuse it. Just ask it again. https://youtu.be/hPH5_ulHtno?t=05m30s If it doesn’t work, throw it away and redo it. https://youtu.be/hPH5_ulHtno?t=20m02s Keep an impossibility list. Revisit it whenever a new model drops. https://youtu.be/hPH5_ulHtno?t=20m02s Never ask for just one output from an LLM. Ask for a dozen. https://youtu.be/hPH5_ulHtno?t=22m20s Our imagination is the limit. https://youtu.be/hPH5_ulHtno?t=26m35s Two years ago, they were like grade 8 students. Today, a postgraduate. https://youtu.be/hPH5_ulHtno?t=00m47s Do as little as possible. Just wait. Models will catch up. https://youtu.be/hPH5_ulHtno?t=31m45s Funny bits: ...

This talk is an experiment. I am going to talk (literally) to ChatGPT on stage and have it do every kind of data analysis and visual storytelling I have ever done. Bangalore. 27 June. Of course, this is an LLM era away. So no promises. We might be doing something completely different on stage. LinkedIn