I read 52 #books in 2021. The best #nonfiction was The Almanack of Naval Ravikant. Succinct & deep. I can spend a decade practicing every sentence. The best #fiction was Brandon Sanderson’s Rhythm of War. A brilliantly rich magic system, and what a plot, what an ending! My one-line #reviews of the books are below. http://www.s-anand.net/blog/books-in-2021/ LinkedIn
2021

Books in 2021
On my Goodreads 2021 reading challenge, I read 52/50 books in 2021. I managed 47/50 in 2020 (see 2020 reviews) and 26/24 in 2019. Here’s what I read (best books first). Mind-blowing The Almanack of Naval Ravikant. It’s the best non-fiction I’ve read in 5 years. It focuses Wealth and Happiness. It’s short. I finished it in a day. But it’s deep. I can spend a decade practicing just a single sentence. It’s available at navalmanack.com as a free e-book and audio book. Rhythm of War. The 4th book of the Stormlight Archives is an action-packed fantasy. A great gift for teenagers. In an extra-ordinary magic system, Brandon Sanderson builds up to the greatest climax I’ve read. What an ending! Death Note #1-#12. Light Yagami gets hold of a “death note”. If he writes a name on it, they die. “L” is out to catch him. In a cat-and-mouse psychological thriller, Light and L work next to each other, share their plans, and still try to outwit the other. It’s like chess. The pieces are visible. But it’s the strategy that counts. A brilliant comic series. Life-changing ...
Can foreigners break into #Hollywood? A break into films is hard. Particularly when you’re a foreigner. But is Hollywood more open or less open than other countries? If we go by iconic actors, the numbers are not encouraging. Just 2% of Will Smith’s co-stars are non-Hollywood. But over 30% of Jackie Chan’s co-stars are non-Chinese. But #clustering shows that Hollywood is actually among the most open to foreigners. #dataanalysis Read more at https://www.s-anand.net/blog/can-foreigners-enter-hollywood/ ...

Can foreigners enter Hollywood?
An aspiring Malaysian actor posted on Reddit: I am a 18-year old biracial Malaysian kid who wants to be an actor in Hollywood. I’m taking a diploma for performing arts in a college called Sunway University in 8 days and I’m considering pulling out of it because why do something that I like when my dreams might never be fulfilled and the price for taking this diploma is seriously expensive. I am starting to doubt my chances of making it to Hollywood and I suffer from extreme anxiety. Is it possible for someone like me to enter Hollywood? What are my chances? ...
Arvind Venkatadri put together a #datavisualization course in #R titled “R for Artists and Designers”." Beautifully crafted. Brilliantly structured. I loved it! https://r-for-artists.netlify.app/ LinkedIn
Over 30 people have created data comic stories for the #DataComicgen awards. Getting insights from data is hard. Telling stories from these is harder. Telling comic stories is the hardest. Yet, these two dozen stories simplify data into simple (and even interactive) comic narratives. Hats off, participants. Hats off! https://gramener.com/comicgenfriday/awards/gallery2021/ LinkedIn

Picking gifts is hard
What do you pick for someone you don’t know well enough? I generally pick books. I know books well enough to match them to people’s personalities. Even if they’re not a book reader. (The risk is that they might have already read the book.) As for the kids, toys like the tiny tower diy playhouses for sale would bring them so much joy. The other safe item is food. Chocolates, dry fruits, etc. Everyone likes them. (Even if they’re dieting, dry fruits and dark chocolates are fine.) ...
The most under-rated #geospatial capability is spatial joins, IMHO. It lets you draw correlations from #geodata. During the 2019 assembly elections in India, it allowed me to join voter data (by constituency) with religious population (by district) and show that BJP’s vote share increased with Muslim population, while it reduced the AIMIM-allied JD(S) vote share. That’s just the start. We can explore: Where to open new schools? Where to locate bank branches? Does wealth lead to more or less theft? Does poor health lead to more or less pharmacies? … and hundreds of other random questions. My day job doesn’t let me explore these much. I’d love to work with someone, though. ...
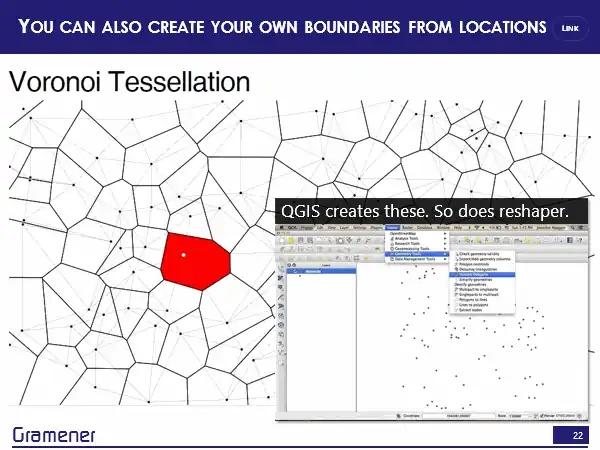
Maps, Delimitation, and Gerrymandering
I delivered a talk at PyCon India 2019. My slides are on Github. This is a transcript of that talk. What I’m going to be talking about is how you can get insights by joining two maps but before we go there, just some basic bookkeeping things. In case you’re tweeting, these are the hashtags, you probably want to be using the #PyconIndia, my hashtag my IDs, #SANAND0, you don’t need to worry about the slides, they are online. I’ve already posted on Twitter, the link to the slide deck, the slide deck that you’re using but if you desperately do want to take notes, then one small suggestion. Research has shown that taking notes on pen and paper is much better than taking notes on laptops if you want to remember stuff or on mobile phones. So this was a discovery for me. In fact, it was my discovery of the year and I’m following it diligently. Do give it a shot if you want to take notes. Let’s dive in. ...
I’m really looking forward to this Data Comicgen #event. Get the #data on 5 Aug Analyze it with #googlesheets Use Comicgen for #comics #storytelling Submit on 26 Aug It’s a great opportunity to find fellow data storytellers and comic enthusiasts – to see their work and share yours. And win awards. LinkedIn
Is your code built to last? Mohammed Niyas P shares a developer war story. His shortcut worked. It delivered working code. But 5 years later, when it failed, he didn’t expect he’d still be around to clean it up. https://gramener.com/developerwarstories/this-tech-debt-made-me-humble Found this tale on technical debt interesting? Gramener is #hiring #developers for a technical lead role. See https://gramener.com/job/?id=90520 Nikhil Kabbin – your story’s up next 😉 LinkedIn
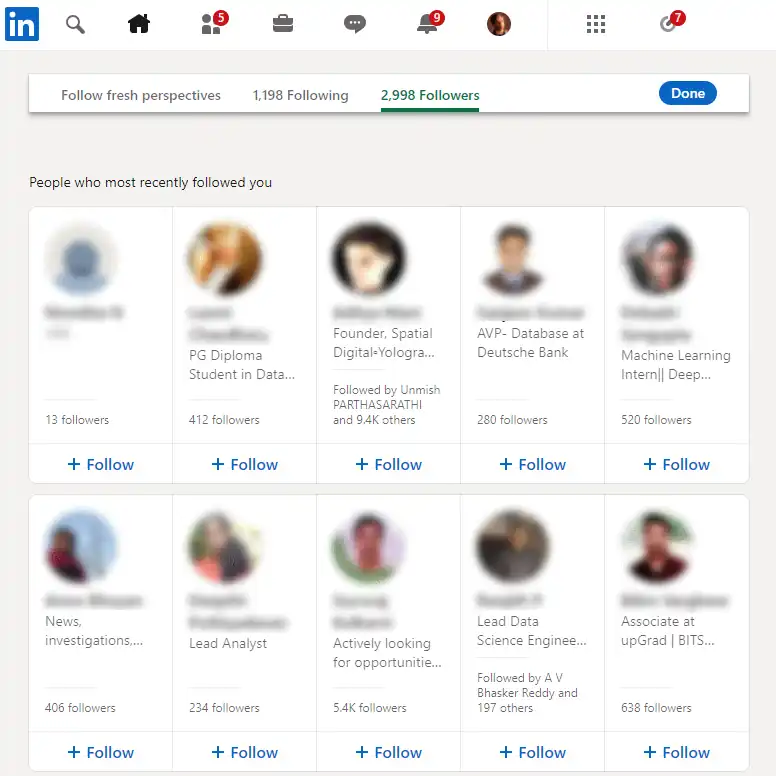
Cyborg scraping
LinkedIn has a page that shows the people who most recently followed you. At first, it shows just 20 people. But as you scroll, it keeps fetching the rest. I’d love to get the full list on a spreadsheet. I’m curious about: What kind of people follow me? Which of them has the most followers? Who are my earliest followers? But first, I need to scrape this list. Normally, I’d spend a day writing a program. But I tried a different approach yesterday. ...

The #HarryPotter Screen Time video featured a bar chart race made in PowerPoint. Many of you asked how I made it. Here’s a step-by-step tutorial. https://youtu.be/E1SeoUV8awI (BTW, there are just 9 people on LinkedIn who match “bar chart race” and #powerpoint. This is for you, friends!) Gramener converted this feature into a product, SlideSense.ai. But more on that later 🙂 The original video is at https://www.linkedin.com/feed/update/urn%3Ali%3Aactivity%3A6801138072068214784/ LinkedIn

I spent 10 hours this week mining for diamonds. I found just 8! I badly need Fortune III on my pickaxe. But today, my biggest worry is sorted out. Diamond is back in usual quantities in Minecraft 1.17! https://www.windowscentral.com/minecraft-bedrock-edition-1-17-2-hotfix LinkedIn
I had a lovely interaction with Kaushik Das at Star TV. The goosebump moment for me was when he said, “… my boss called me the next day, and said that I’ve been playing with it since you showed it to me. And yeah, this is amazing! Why didn’t we do this before? Thanks, Star TV Network & Gramener teams, for your night-outs, weekends, and relentless energy – and building a TV Rating #analytics platform you can be proud of. ...
I’m running a #webinar for #developers & #designers on Thu 17 Jun. It’s on creating data-driven infographics – without much code. This is based on new open-source #webcomponents Gramener is releasing - which makes it easy to map SVG attributes to data. It’ll be a light, fun workshop where YOU will build something. You can register at https://info.gramener.com/creating-data-driven-infographics-with-web-components Note: Webinar recording it at https://youtu.be/Np50SvvX8UY LinkedIn
Could you spare a minute & share your COVID-19 vaccination cost, please? LinkedIn
This is my first Lightboard video – interacting with a data visualization on-camera. Hans Rosling did something like this with BBC 4. That’s been my inspiration. In this video, I share the screen time of the Harry Potter supporting cast. The bar chart race was created in PowerPoint, and the lightboard effect was created with OBS. (I’ll share a tutorial soon.) What do you think of the video? Any comments? Questions? ...
Comicgen now has a very versatile character – Aavatar. Pick your gender. Hairstyle. Emotion. Attire. Pose. Colors. Create your own character. (It’s open-source.) https://gramener.com/comicgen/v1/ The variations are staggering. It throws up surprising ones too, like crossdressers or bald women in sarees 🙂 What I’m struggling with is: Who needs this? What could they do with it? I’m not sure. If you have ideas or know someone who might, please let me know 🙏 ...
I’ve a theory. PowerPoint can do anything. (Excel too). Shape operations are especially powerful. In this tutorial, I create an address card icon and export it as SVG. I don’t need Sketch / Illustrator for this. They’re great. But no, thanks. I’m pretty good with PowerPoint 😄 Have you seen PowerPoint do anything that made you go “Wow! This is cool!”? Do share. I’d love to hear about it. http://www.s-anand.net/blog/designing-complex-shapes-in-powerpoint/ LinkedIn