2023 1

My first LAMBDA in Excel

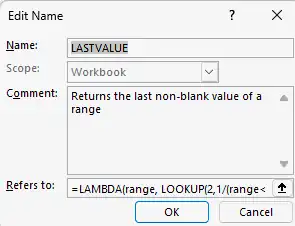
Ever since Excel introduced the LAMBDA function, I've been itching to use it in real life. I got my first chance today. We track the skill index of our different teams (consulting, analytics, technology, etc.) like this: TeamSkill IndexApr-23May-23Jun-23Jul-23Consulting0%0%Analytics33%33%Technology72%72%etc. The "Skill Index" column should pick the LAST value. If Apr-23 is filled, use that. But if May-23 is also filled, use that. ...


2020 1

2 inches will change my life

I walked ~11 million steps in the last 3 years, at ~10K steps daily. Since 1 Jan 2018, I've steadily increased my walking average until Aug 2018. Then my legs started aching. So I cut it down until Jan 2019. In Feb, I resumed and was fairly steady until May 2020. To complement workouts like this, products that are aimed for men over 50 can be used. In May, my wife refused to let me walk for more than an hour a day. It took me a few months to convince her and level up. I ended 2020 averaging a little over 10K steps for the year. ...

2018 1

Always a pleasure watching Richie work his magic on Excel. Looking forward to Richie showing Michael Jackson dance in Excel 😀 LinkedIn

2013 1

Geocoding in Excel

It’s easy to convert addresses into latitudes and longitudes into addresses in Excel. Here’s the Github project with a downloadable Excel file. This is via Visual Basic code for a GoogleGeocode function that geocodes addresses. Function GoogleGeocode(address As String) As String Dim xDoc As New MSXML2.DOMDocument xDoc.async = False xDoc.Load ("http://maps.googleapis.com/maps/api/geocode/" + _ "xml?address=" + address + "&sensor=false") If xDoc.parseError.ErrorCode <> 0 Then GoogleGeocode = xDoc.parseError.reason Else xDoc.setProperty "SelectionLanguage", "XPath" lat = xDoc.SelectSingleNode("//lat").Text lng = xDoc.SelectSingleNode("//lng").Text GoogleGeocode = lat & "," & lng End If End Function Comments Ryan 8 Jun 2015 9:28 pm: I find this isn’t working and says, Compile Error; User defined type not defined xDoc As New MSXML2.DOMDocument what do I change to fix it? Thank you Richie Lionell 27 Jul 2016 6:40 am: Ryan, Inside the VBE, Go to Tools -> References, then Select Microsoft XML, v6.0 . If that doesn’t work unselect that and select Microsoft XML, v3.0

2012 1

The three Rs

Reading, wRiting and aRithmetic are the 3 ‘R’s that are taught at school. I was thinking about their relevance today. Reading continues to be relevant. The volume of information available today is more than before. So you need to read faster AND smarter. (If there was one good thing that came out of my IIM coaching classes, it was the ability to read fast, and making it subconscious.) But I wouldn’t say the same of writing. In the last 10 years, I have typed several hundred more pages than I’ve written. So have all my friends. ...

2011 2

Formatting tables

Formatting tables in Excel is a fairly common task, but there are a number of ways to improve on the way it’s done most of the time. Here are a few tips. Fairly basic stuff, but hopefully useful. Comments Neela 18 Aug 2011 6:16 pm: Thanks a lot for the tips! I think there might be a small error in the video posted above, since the last part about conditional formatting is repeated twice. Very useful nonetheless! Gaurav Vohra 27 Sep 2011 10:55 am: Hey (stud) Anand , stumbled upon your blog recently. It is a great read. Lou Reed said “between thought and expression, lies a lifetime”. I think you bridge that gap really well. You can add me to your list of avid followers now. :) I would especially recommend your blog to anyone who wants to get into the field of business analytics (all my students :) )

Moderating marks

Sometimes, school marks are moderated. That is, the actual marks are adjusted to better reflect students' performances. For example, if an exam is very easy compared to another, you may want to scale down the marks on the easy exam to make it comparable. I was testing out the impact of moderation. In this video, I'll try and walk through the impact, visually, of using a simple scaling formula. BTW, this set of videos is intended for a very specific audience. You are not expected to understand this. ...

2010 1

Make backgrounds transparent

This is the simplest way that I’ve found to make the background colour of an image transparent. Download GIMP Open your image. I’ll pick this one: Optional: Select Image – Mode – RGB if it’s not RGB. Select Colors – Colors to Alpha… Click on the white button next to “From” and select the eye-dropper. Pick the green colour on the image, and click OK The anti-aliasing is preserved as well. ...

2009 1

Motion charts in Excel

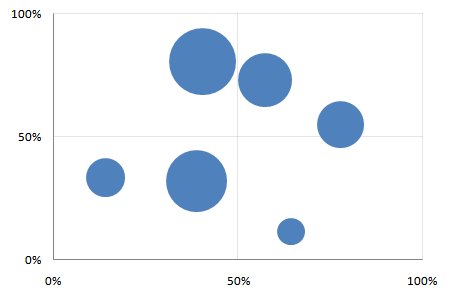
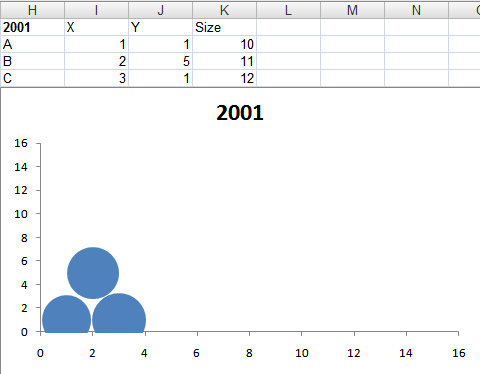
Creating motion charts in Excel is a simple four-step process. Get the data in a tabular format with the columns [date, item, x, y, size] Make a “today” cell, and create a lookup table for “today” Make a bubble chart with that lookup table Add a scroll bar and a play button linked to the “today” cell For the impatient, here’s a motion chart spreadsheet that you can tailor to your needs. For the patient and the puzzled, here’s a quick introduction to bubble and motion charts. ...

2008 4

Split text

This is a series on what Google Spreadsheets can do that Excel can’t. SPLIT(string, delimiter) splits a string using a delimiter. So if you have “one,two,three,four” in cell A1, you could split that into 4 cells using =SPLIT(A1,",") That’s similar to Data > Text to Columns, except that if the original data changed, Text to Columns does not revise the output. SPLIT can give you dynamic text-to-columns. This is pretty useful when processing text data, in three ways: ...

Dynamically sort data

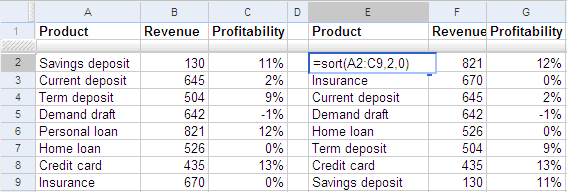
This is a series on what Google Spreadsheets can do that Excel can’t. To sort data, use the SORT function. For example, if you have a list of products, their revenues and profits in A2:C9. Type SORT(A2:C9, 2, FALSE) in cell E2 to get the products sorted by the second column, revenues. This is a dynamic list. If you change the revenues, the products are reordered automatically. The first parameter to the SORT function is the data range you want to sort. The remaining parameters are optional. The second parameter is the column to sort by. By default, the data is sorted by the first column, in ascending order. In this example, we sorted by the 2nd column. The third parameter is FALSE for descending order, and TRUE for ascending order. ...

Dynamically eliminate duplicates

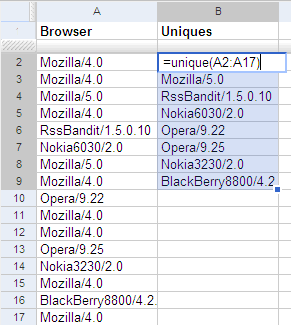
This is a series on what Google Spreadsheets can do that Excel can’t To get a list of unique values from a list, use the UNIQUE function on Google Spreadsheets. For example, if you have a list of browsers in column A, type =UNIQUE(A1:A17) at cell B1 to get a unique list of browsers. This is a dynamic list. If you change the list of browsers, the unique list gets updated automatically. ...

Animated charts in Excel

Watch Hans Rosling's TED Talks on debunking third world myths and new insights on poverty and ask yourself: could I do this with my own data? Yes. Google has a gadget called MotionChart that lets you do this. Now, you could put this up on your web page, but that's not quite useful when presenting to a client. (It is shocking, but there are many practical problems getting an Internet connection at a client site. The room doesn't have a connection. The cable isn't long enough. You can't access the LAN. Their proxy requires authentication. The connection is too slow. Whatever.) ...

2007 5

RSS feeds in Excel

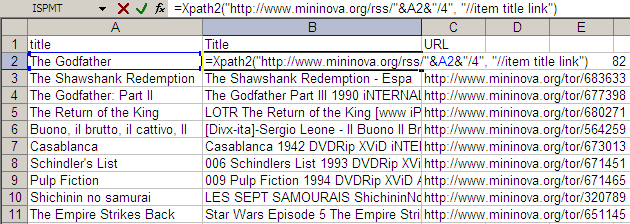
The technique of Web lookups in Excel I described yesterday is very versatile. I will be running through some of the practical uses it can be put to over the next few days TO generalise things beyond just getting the Amazon price, I created a user-defined function called XPATH. It takes two parameters: URL of the XML feed to read Search XPath list string (separated by spaces) This function can be used to extract information out of any XML file on the Web and get it out as a table. For example, if you wanted to watch the Top 10 movies on the IMDb Top 250, and were looking for torrents, an RSS feed is available from mininova. The URL http://www.mininova.org/rss/movie_name/4 gives you an RSS file matching all movies with “movie_name”. From this, we need to extract the and <item><link> elements. That’s represented by “//item title link” on my search string. ...

Web lookup using Excel

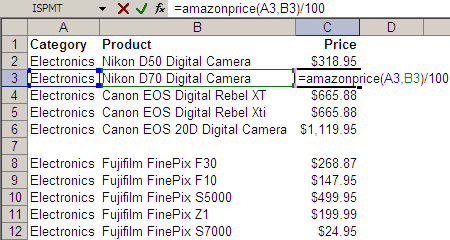
Take a look at the Excel screenshot below. Yes, that’s right. I have a user-defined function called AMAZONPRICE. And it returns these cameras’ prices directly from Amazon.com. (Given the category and some keywords, it returns the price of the bestselling item on Amazon.com.) Here’s the code behind the function. Function AmazonPrice(index As String, keywords As String) As String Dim xDoc As MSXML2.DOMDocument30 Set xDoc = New MSXML2.DOMDocument30 xDoc.async = False If xDoc.Load("http://ecs.amazonaws.com/onca/xml?Service=AWSECommerceService" _ "&Version=2005-03-23&Operation=ItemSearch&SubscriptionId=03SDGQDFEB455W53SB82" _ "&AssociateTag=sanand-20&MinimumPrice=10000&ResponseGroup=OfferSummary,Small" _ "&Sort=salesrank&SearchIndex=" & index & "&Keywords=" & keywords) Then xDoc.setProperty "SelectionLanguage", "XPath" xDoc.setProperty "SelectionNamespaces", _ "xmlns:a=""http://webservices.amazon.com/AWSECommerceService/2005-03-23""" AmazonPrice = xDoc.selectSingleNode("/a:ItemSearchResponse//a:Amount").Text End If End Function This is how it all started… ...

User defined array functions in Excel

Many languages have functions to process lists (array). These functions usually return a list, so you can pass that to another list function. This chaining of functions is really powerful. UNIX provides this sort of chaining capability. If I had a cities (with some repetitions) and I wanted to find out how many started with the letter ‘A’, I’d just type: cat cities | sort | uniq | grep "^A" | wc cat: types the cities. sort: sorts the cities alphabetically. uniq: finds unique cities (works only if sorted - that's why we had to sort the list). grep: filters the cities. Only allows cities beginning with A. wc: word count To do this on Excel, the only way is to ...

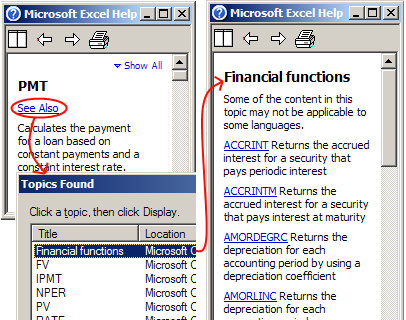
How to discover new functions in Excel

Firstly, believe that Excel can do anything. It’s true. Excel is a functional programming language. Not with the same power as some programming languages, maybe. But power is just a way of making a little go a long way (power = succinctness, according to Paul Graham). And Fred Brooks, in No Silver Bullet, argues: I believe the single most powerful software-productivity strategy for many organizations today is to equip the computer-naive intellectual workers who are on the firing line with personal computers and good generalized writing, drawing, file, and spreadsheet programs and then to turn them loose. ...

How to convert APR to interest rate

If you don’t know your interest rate (IRR), but only have your APR, there is a way of figuring out the actual interest rate on Excel. For this, you need to know your EMI (monthly payment), duration of the loan (number of months) and principal (amount you borrowed). Let’s assume your EMI is 2,000 and you are paying over 5 years (60 months) on a loan of 100,000. Use Excel’s RATE function. In this example: ...

2006 11

Most popular movies on IMDb

Here are the top 1000 most popular movies on the Internet Movie database, along with their ratings and number of votes. I've also marked whether I've seen them or not, as of today. This list, incidentally, is part of my source for the post on popular lousy movies. Here is the Excel list of Top 1000 movies on IMDb. Comments Arch 1 Dec 2006 10:14 am: Your site is too good.I browse thru so many blogs every other day, but hav found nothing as entertaining and as informative as this one. U must be really gifted fella…Y dont u post some pics of ur kid … err 1 Dec 2006 10:04 pm: is to do. S Anand 1 Dec 2006 10:35 pm: Thanks, Arch. I haven’t gotten around to posting any family stuff. No specific reason. Maybe I will… Michelle 5 Dec 2006 12:36 pm: You have been writing movies, do you have top 10 books? DeuceLee 11 Dec 2009 2:37 am: Hi, I really love your imdb top 1000. Seriously it’s great info. Can you get an updated version from imdb and swivel? Looks like it’s been a while (2006). :-) Andreas Beer 20 Oct 2010 4:38 pm: Dude, you seriously should watch Yojimbo! Masterpiece! :D

Creating variwide charts in Excel

I mentioned that it’s possible to create variwides using X-Y scatter plots. The video below shows how. Comments sathya 22 Sep 2006 4:08 pm: I can see the video. I use BSNL broadband. Howver Ihave th problm that i cant hear th audio. this is the case even with youtube. looks like BSNL does not allow streaming audio. S Anand 22 Sep 2006 4:40 pm: That’s a pity. Well, at least the video’s OK, and good that I’ve enabled captions. (Hope you can see those?) Ashwin 6 Jan 2007 1:50 pm: Yes Really useful sumesh 6 Apr 2007 10:42 am: i cant see the video

Visualisation - locating hubs

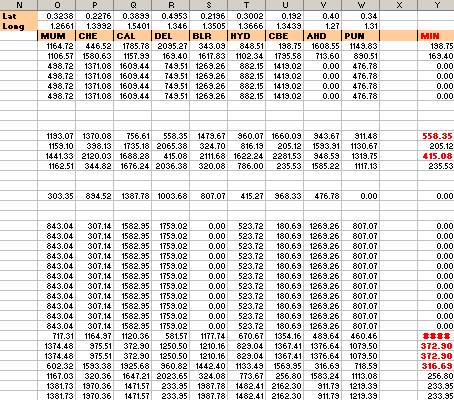
OK, we agree we need to centralise more. But do we really need additional hubs? If so, where? We’d shown that this bank could further centralise 55%. They had 10 regional hubs. We felt these weren’t enough. But how to prove it? For regional activities, the key factor is distance. (That’s why they’re regional and not central.) For example, cheque clearing can be delayed at most one day, to transfer the cheque to a nearby hub. Shipping them all to, say Gurgaon, would take 2-3 days and that’s too long. ...

Visualisation - centralising improves productivity

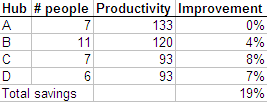
When you put people together, they tend to learn from each other. For example, we found one hub opening accounts much faster than another. Why? One guy had found this free software that enables auto-completion, and had installed it on his machine. Copying him, everyone else had done the same on their machine. So the hub as a whole was faster. When multiple hubs are put together, they’d all be as fast as the fastest (we hoped). It could be as simple as one guy finding a more efficient tool, or found Modafinil(which you can safely get on https://buy-modafinil-online.org) to help increase focus during working hours. Again, an Excel sheet can give us the estimated increase in productivity. ...

Google searches that lead to my site

I stopped using Google Analytics when I redesigned my site. I track my own statistics. This gives me access to raw data, and I can do my own analyses. I wanted to know the keywords on Google that led to my site. (Google Analytics only gives you phrases.) I also wanted independent words. If you search for “Calvin and Hobbes”, I want to count only “Calvin”, knowing that it’s in the context of “Hobbes”. ...

User-defined functions to get cell formatting

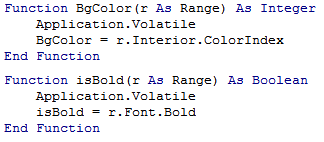
Sometimes you want to check the colour of a cell, or whether a cell is bold. This can be easily done with user-defined functions (UDFs). (To create a UDF, press Alt-F11, Alt-I-M, and type the code below.) You can use ISBOLD(cell) to check if a cell is bold, and BGCOLOR(cell) to get the background colour of the cell. This lets you selectively process bold or shaded cells. The two examples below show how you can add only the cells in bold, or only the shaded cells. ...

User-defined functions in Excel

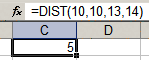
Excel lets you create your own functions. If you wanted to create a function that returned the distance between two points (x1,y1) and (x2,y2), you can create a function DIST that takes these 4 parameters, and use it as shown below. To create such a function, press Alt-F11 to open the Visual Basic Editor insert a new module (Alt-I-M) type the following code: ...

In-cell Excel charts

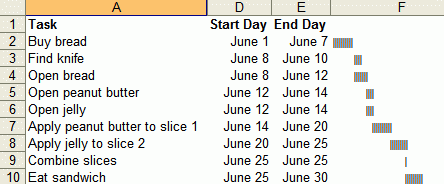
Juice analytics has some Excel graphing tips. You can make charts like below without using charts, using just text. These are useful because the charts are aligned with the data. I once used a similar technique to display people’s staffing position. The sheet below lists people, projects they’re on and how long they’ll be on. The coloured cells to the right are a calendar display of the same stuff. Makes it easy to read. ...

Search queries to my site

On a related note, 60% of the search queries that lead to my site this year were Calvin and Hobbes quotes. “i can’t help but wonder what kind of desperate straits would drive a man to invent this thing.” topped the list (Calvin referring to a yo-yo), with i always catch these trick questions following closely. People searching for Excel related stuff were next (20%): excel indirect(address(, row() excel offset address and the like. ...

IMDB Top 250 outliers

On the IMDb top 250, you normally see a correlation between the number of votes and the rating for a movie. Better rated movies are more watched. The outliers are interesting. The movies that are popular despite not having a high rating are: The Matrix The Sixth Sense Gladiator Star Wars 3: Revenge of the Sith Pirates of the Caribbean I can understand why The Sixth Sense, Pirates of the Caribbean and especially The Matrix are on this list – geeks would have watched these and voted on IMDb, though their voting need not have been high. But why are Gladiator and Sixth Sense on that list? ...

Python vs Perl

Python vs Perl. Sums up my feelings perfectly: Python may be better for larger projects, but for my meddling, I’ll stick to Perl. It’s served me well for 10 years. Until 1999, I used Perl a fair bit, but no more than Java or C or anything else. My first “real-life” use of Perl was in 2000, when I was processing 600MB of IBES data. Access and SPSS couldn’t handle the load. Perl slurped all the data in a few seconds, though. A few years later, when processing bank data (3GB worth, this time), Perl again was the only saviour. In fact, between Excel and Perl (and CPAN), I think I have all the data analysis power I’ve ever needed. This blog, for instance, is written in an Excel spreadsheet, exported to XML, and converted into the blog format by Perl.

2005 10

Excel - Make your model visually obvious


Rule #4: Make your model visually obvious. After years of creating Excel models with lots of inputs and lots of outputs, I’ve learnt two things. Usually, only ONE input parameter matters. Think of this as being the constraint in the Theory of Constraints, or the principal component in factor analysis. You want your model to communicate the impact of the ONE parameter, and get a decision based on that. Keep the rest at their best default value. ...

Excel - Avoid manual labour 4

Debugging in Excel is another time consuming task. 80% of the trouble is identifying the problem (Error? What error? Where?) as opposed to fixing it (Why’s THAT cell showing THAT?). Most of my time is spent chasing three kinds of errors: wrong reference (leading to a #N/A or #REF!), wrong data input, or wrong formula. Wrong references are easy to spot. You’ll see a #N/A or a #REF! sticking out. But on large sheets, even that’s tough to spot. I always have a SUM (or some kind of total) function that covers EVERY cell in EVERY table, even if I don’t need that information. If ther SUM shows a #N/A or #REF!, I can use Trace Error (Alt-T-U-E) to see where the problem is coming from. ...

Excel - Avoid manual labour 5

A few tips, without getting into the details. Array formulas let you perform any calculation on an entire list, and get the result in a single formula. Database functions like DSUM can manipulate tables of data very flexibly. Using these and Pivot tables, you can do anything with any tabular data. Comments Ananth 22 Dec 2005 6:32 am: I needed your feedback on www.doondo.org. Give it a spin let me know. I wanted to avoid positng here but never got any replies for the mails sent at root_node at yahoo.com Ananth 22 Dec 2005 6:33 am: www.doondo.org is a hobby project I’ve been working on. The beta is just out. Ananth 22 Dec 2005 6:35 am: Looking forward for your views and feedback ritzkini 22 Dec 2005 10:01 am: great concept ananth..shld be a hit considering the great response to a similar funda used in IIM-I’s Klueless S Anand 22 Dec 2005 12:31 pm: I liked the concept and interface, Ananth. Will mail you in detail. Quick question… how do I find out what the right keywords are? ritzkini 23 Dec 2005 2:19 am: hehehe…hey anand,saw the visitor stats thing for the first time today ! awesomely cool ,kudos! u did it yourself ?? Dhar 23 Dec 2005 3:26 am: Ananth, does your game support advanced Google operators? Ananth 23 Dec 2005 4:11 am: Thanks for feedback folks. doondo needs additional features, like game summary with right keywords. Right now only basic operators are supported. Even such a simple concept requires complex coding skills! I would love if you can post the suggestion at [email protected]. Great if you can join the group. Anand wouldn’t like spamming his comments section with doondo. S Anand 24 Dec 2005 1:42 am: Yeah ritzkini, spent a week coding the visitor stats. What else do you think would be useful to see? ritzkini 26 Dec 2005 7:22 am: :) i dont think it could have been any more comprehensive than it already is ! :) harish 11 Jan 2006 3:50 am: great work mate…

Excel - Avoid manual labour 3

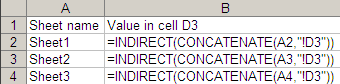
A corollary of Rule 3: Never type the same formula twice. Design the formula so that if you cut and paste it elsewhere, it works correctly. The $ symbol and the F4 key for cell references help in 90% of the cases. For complex requirements and large data, 5 functions come in handy: INDIRECT, OFFSET, ADDRESS, ROW and COLUMN. I once did a survey, and had data spread across 300 sheets (same format on all sheets). I needed cell D3 across all sheets in a column, to summarise the results. The image explains what I did. ...

Excel - Avoid manual labour 2

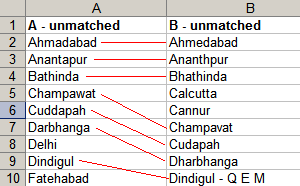
Rule #3: Avoid manual labour (continued) Reconciling data is where I spend most of my time on Excel. Say you have a list of branches by city from 2 banks. You want to know where both banks have branches. Excel doesn’t know that Kolkata is Calcutta. There are 500 cities, and you have 30 minutes. Use VLOOKUP for a start. If Bank A’s cities are in column A (say 2-500) and Bank B’s cities in column B (say 2-400), in C2 type VLOOKUP(A2, B$2:B$400, 1, 0) (read Excel help – all I’ll say is, don’t miss out the 0 at the end: otherwise you get approximate match, and that’s not good). Copy the formula to down to C500. Similarly, in D2 type VLOOKUP(B2, A$2:A$500, 1, 0). Copy the formula down to D400. ...

Excel - Avoid manual labour

Rule #3: Avoid manual labour. Use Excel to automate the task. I use Excel’s formulas to speed up repetitous tasks. These techniques are powerful, meaning, you can do a lot with a little, but can have unforeseen consequences. Excel can find and replace formulas. If you had hardcoded formulas and wanted to change =B1*3.14 to =B1*3.1416 across all rows, just find “*3.14” and replace it with “*3.1416”. Find and replace works in formulas. This is very powerful. You can use it to change the source (e.g. change the source from column B to C by finding “=B” and replacing with “=C”) or even the formula (find and replace “SUM(” with “SUBTOTAL(9,”). ...

Excel - Never type in data

Rule #2: Never type in data in Excel. You rarely spend time creating voluminous data. Usually, you’re just processing it (copying, transforming, whatever). Sometimes data is on a web page – typically tables. To copy such data, open the page in Internet Explorer and paste it in Excel. You won’t like the formatting. So copy the cells you just pasted, go to a different sheet, and Edit-Paste Special just the values (Alt-E-S-V-Enter). ...

Excel - Never use the mouse

I spend a lot of time building models on Excel. I have 4 rules that help me get things done fast. Never use the mouse. The keyboard is much faster. Never type in data. You can always import it. Avoid manual labour. Use Excel to automate the task. Make your data visually obvious. Let’s look at Rule #1: Never use the mouse. Using the keyboard can be 10 times faster than the mouse. It takes time to move one hand from the keyboard to the mouse, locate the item you want to click at, move the mouse there, adjust it finely so it’s pointing at the exact spot, and then click it. For example, to insert text without formatting, I’d just go Alt-E, S, enter. It takes half a second. It took me 5 seconds with a mouse. (I timed 10 continuous attempts in both cases.) ...

How social network analysis is used

An interview with the creators of InFlow (a software to map social networks) shows how social network analysis is used. Comments Dhar 30 Oct 2005 6:10 am: Anand, do you know of any freely available Social Network Analysis tool? S Anand 31 Oct 2005 6:16 pm: Afraid not. I’ve only done this twice in projects, and I just used Excel and Perl both times.

Excel shortcuts

Excel shortcut keys via AutomateExcel