2026 4

LinkedIn Blog

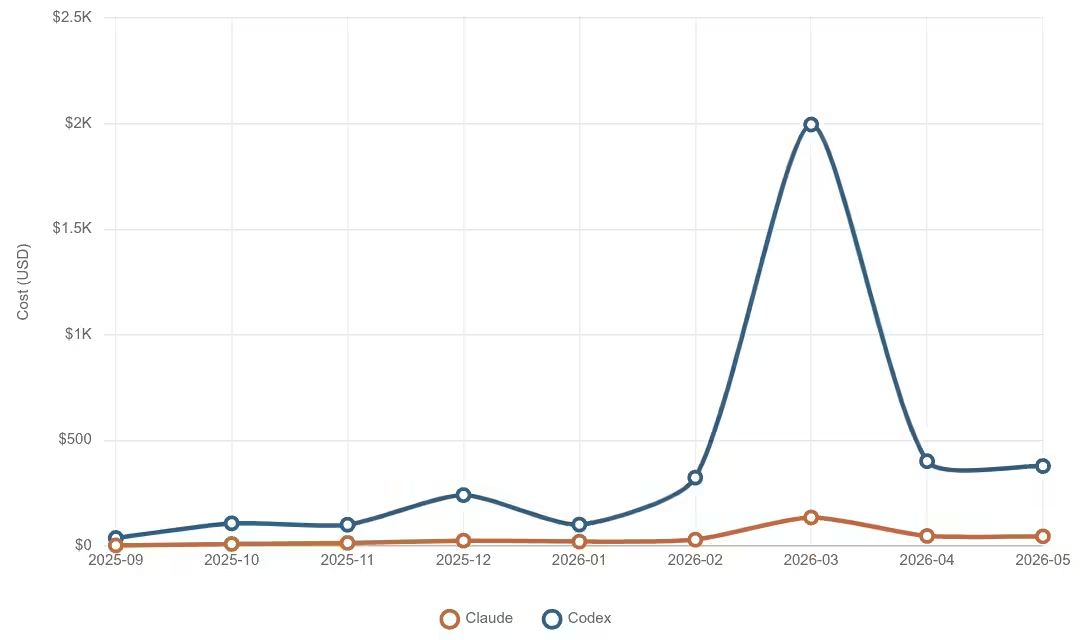
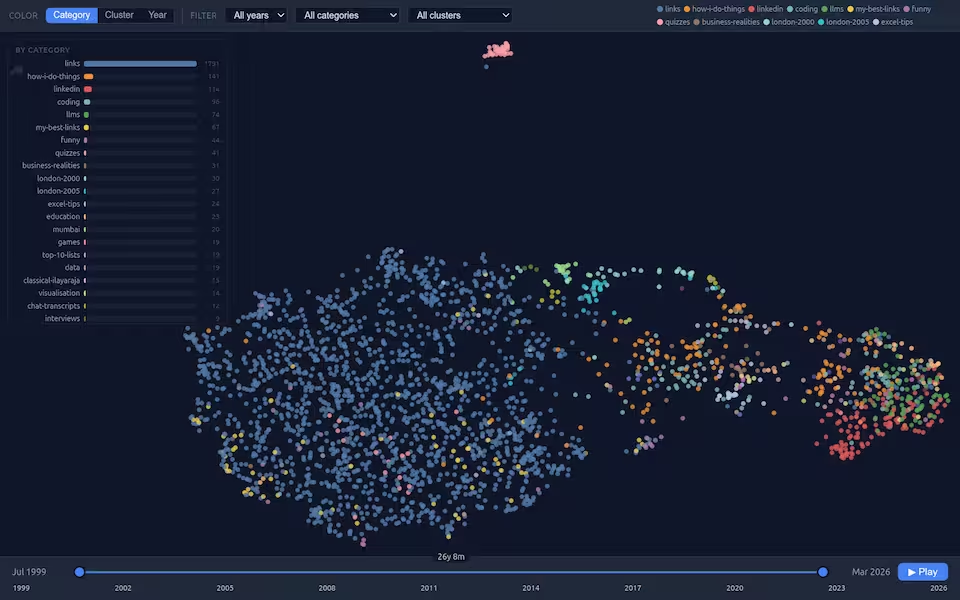
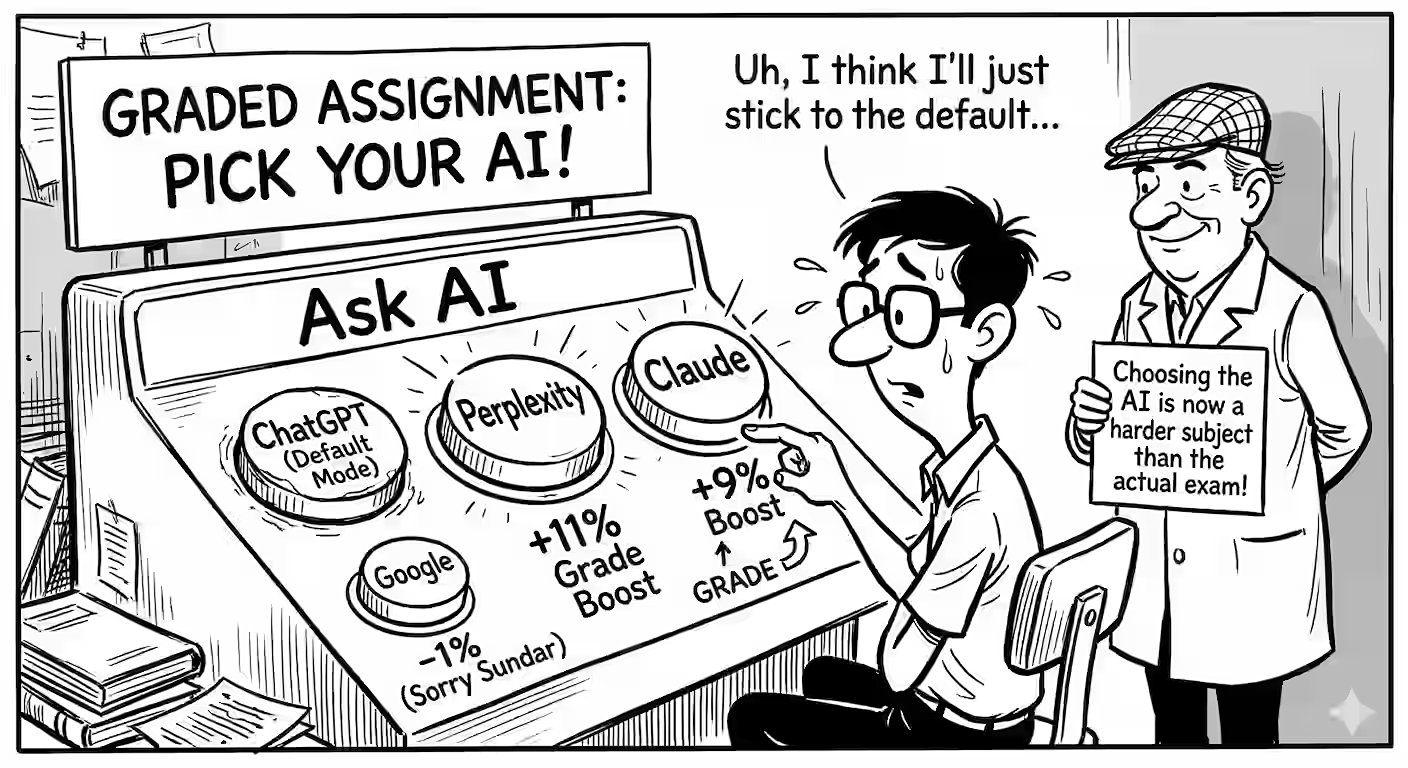
Pick next month's LinkedIn posts from my blog. - Blog: ~/code/blog/posts/YYYY/\*.md (frontmatter: title, date, categories, tags, description, and `linkedin:` if already posted) - LinkedIn dump: ~/Documents/data/linkedin-posts.jsonl (type=post and type=comment; posts have impressionCount, reactionCount, commentCount, repostCount, postedText as a RELATIVE age like "2mo") Based on a Jul 2026 analysis of 169 posts + LinkedIn metrics: - Audience: ~750 founder/CEO/CTO/chief titles, ~570 engineers and data scientists, ~280 product. India and Singapore heavy. They read for a decision they can act on or a story they recognise. - My top posts have a reach (vs a typical post that month) of: 1. 8.6x - Everyday observation with a twist. Specific, visual, slightly absurd, mild grievance welcome. E.g. Plastic-cover-on-phone 185K, no-entry-for-sandals 47K, kind-air-hostess 36K, hot-cookies 27K. 2. 14-87x - A number that flips a default decision. "GPU or API" 663K, "which LLM gets better grades" 64K. Ensure a concrete decision. 3. 34x - A free thing usable today. TDS-free 285K, 60 reposts. 4. 4-12x - Exact, reproducible "here's how I did it". Voice-to-slides 93K. What loses: prompt-engineering 0.63x, vibe-coding 0.72x, coding 0.80x, ai-agents 0.79x, llms 0.89x. Workshop recaps get 1,700-2,700. Under 250 words gets a median 8,020 impressions; over 900 words gets 5,303. Pure data analyses (IMF, Wikipedia) get respectable but modest numbers unless they carry personal stakes or an actionable consequence. Reposts (save intent) run highest on benchmarking (7.0 avg) and education (5.9), even when reach is modest. Treat reposts and comments as better signal than reactions. The 2026 baseline is roughly half of 2025 (~4,000 vs ~8,000 median), so don't compare raw impressions across years. I no longer link the blog on LinkedIn: link posts get throttled. So we'll rewrite. ## Method 1. Take blog posts from the last 3 months. 2. Drop any with a `linkedin:` field. Then DO NOT TRUST that field - it has false negatives. For every remaining candidate, keyword-check its distinctive terms (proper nouns, tool names, coined phrases) against BOTH post and comment text in the full dump. Report anything already live. Example of a real miss: "How IMF mis-forecasts GDP growth" had no frontmatter field but was posted a month earlier. 3. Note the dump's max scrapedAt. Anything dated after it is UNVERIFIABLE - say so rather than assuming it's unposted. 4. Clean the dump: discard records where reactionCount > impressionCount (a scraper bug inflates some counts by ~1e9). 5. Auto-exclude: "Things I Learned" digests, workshop and talk summaries, dev-tooling posts (ffmpeg, redirect tracking, shell utilities). These are the developer posts I deliberately keep off LinkedIn. 6. Score each candidate against the four winning patterns. Prefer posts already under 500 words. 7. Portfolio rule: at least 2 of 5 must be non-AI or non-LLM. My feed is already LLM-saturated and that category runs below my own baseline. ## Output - for each of 5 picks, in priority order - Title, date, word count, blog URL - Which pattern it hits, and the specific past post it resembles - A one-line LinkedIn hook, in my voice, that I can use as the opening line - What to cut for LinkedIn (name sections, not "shorten it") - Any risk (named company, staleness, tone) Then: 3 near-misses in one line each, and a list of what you excluded and why. 31 Jul 2026. Created. Sources: https://chatgpt.com/c/6a6ab214-fd78-83ec-b319-3f5645325155 https://claude.ai/chat/c3dd952f-1a20-44a2-8eb3-29860201d8ee Feedback loop - run this first each month ...

Case Study

Create a training pack to help analysts (business analysts, data scientists, strategy consultants, forward deployed engineers, etc.) improve their investigative judgment. Success for the analyst is not recovering the hidden truth you designed. It is making the best evidence-based judgment available from the materials. Design and score for that. First, formulate the underlying dynamics - the hidden mechanisms, reasons, processes - e.g. - why the processes are not/poorly/wrongly documented - why the data is stored, structured, and labelled the way it is - why it has the quality issues that it does - what are the underlying unstated organizational dynamics, etc. Discovering some or all of these would be key to the analyst's success in the exercise. Don't state these dynamics directly anywhere the analyst can see. But they may be partly mentioned, disputed, denied, euphemised, or misunderstood by people who each see only a part of it. That is how it works in real-life. For each dynamic, plan two or more independent channels through which an analyst can detect it (a data pattern, a silence in a thread, a timeline that doesn't line up, a form field abandoned mid-year), and at least one innocent explanation that fits any single channel on its own. Also plant anomalies that mean nothing - in real-life, not everything is a clue, and we want to train for the intuition to tell the difference. Create an instructor-only `case.yaml` that includes all of this as the primary context. Include entities, systems, timeline, people, the process (how was it designed, documented, believed to run, actually runs), the dynamics and where and how each dynamic plays a role. Record every anomaly in the pack in case.yaml, marked as: designed and critical / ambient noise / benign quirk / accidental defect. Fix the accidental defects. Generate every artifact below from `case.yaml` to avoid ACCIDENTAL contradictions. Create realistic documents and datasets that an analyst will likely get when investigating a process like below. This includes: - Documents explaining the process. Reflect real-life, where some processes are undocumented, poorly documented, or wrongly documented. - Datasets. - Both structured (spreadsheets, SQL dumps, geospatial, proprietary formats, ...) and unstructured (text, images, documents with a mix, audio, video, ...). - This may include large transactional/reference data as well as smaller datasets, across a variety of realistic formats. - Think about how organizations realistically store data. There are underlying historical and organizational reasons for why their data evolved the way it did. In real-life, datasets have varying quality, based on the process of collecting and processing them. Datasets are often sourced from multiple systems and processes. The nature of gaps / errors / other quality attributes typically reflect the underlying sources. - Use a format only if this organization would likely produce it and it serves an exercise - not just for variety. - For large transactional data, Use a fake data generator skill when available. Write seeded generator scripts rather than static files. - Supporting material. This may include emails, chat logs, meeting transcripts, system logs, people profiles, etc. that are usually passed to an analyst for context. In real-life, these supporting materials are windows into and reflections of organizational structure, politics, constraints, etc. How it is said, and what is unsaid, is often more important than what is said. - People the analyst can question. Add the profiles to `data/`. Include instructor-only notes explaining what each person knows, believes, is wrong about, and would rather not say. Enough for an instructor (or AI agent) to role-play them and answer questions like them. Deciding whom to ask, and what, is a critical skill. That's how analysts go beyond incomplete / incorrect briefs. The same pack can be used for multiple exercises. Include exercises, each containing: - Objective - a page explaining their task. Realistically, these may be loosely, incompletely, or wrongly defined, or unsolvable without additional data or context, etc. This, too, needs to reflect real-life based on a hidden dynamic. Where the brief is wrongly framed or underdetermined, analysts should reframe it, say what's missing, ask for it, and act safely under uncertainty. If they do that, that's a success, not failure. Don't make something wrong in every objective. Deciding whether to dig is part of the training. Mention who the objective is for, how long it should take, which tools (e.g. AI agents) are allowed, and what output to submit. Require an evidence table - claim | source | confidence - and the hypotheses they rejected, with why. Without this, we can't differentiate between judgment and lucky guesses. Some exercises can be small: one artifact, ten minutes, "does anything here smell wrong?" - including some where the answer is no. Intuition comes from many quick exercises with fast feedback, not just from one long case. - Rubric - not shared with the analyst, but explaining to the instructor: - What the analyst needs to discover in order to succeed in the exercise - mentioning the relevant dynamic. - How to evaluate the analyst's work. Share this as a prompt that can be shared with an expert or an AI agent. The prompt will be shared along with the same inputs passed to the analyst (documents, datasets, supporting material, this exercise's objective) as well as the dynamics. The prompt should clearly explain the steps to evaluate the analyst's work and the scoring rubric along with evaluation criteria and clear definitions of what constitutes a good/bad response, with an emphasis on the hidden dynamics that the analyst needs to discover. Because the evaluator is handed the dynamics, say explicitly: score the evidence and reasoning first, THEN the conclusion. A well-supported alternative conclusion can score as high as the intended one. But the intended conclusion asserted without evidence should not score high. You can use the tone, omissions, timing, and other "non-verbal" aspects of the response as a signal, but treat that as hypotheses needing proof. - Write behavioural anchors for each score level. - Then write test submissions for this exercise, as an analyst would write them - not as someone who knows the answer. For example, if a "good" submission clearly states the dynamic, that's unrealistic. Recommended submissions: 1. Strong: real evidence, traced to files, calibrated, some things still open. 2. Polished but shallow: confident, well written, restates the brief, no evidence. 3. Right conclusion without evidence - a lucky guess. 4. A different conclusion that the evidence actually supports. 5. Says the evidence is insufficient, and asks for the right things. 6. Treats a decoy as a finding. Target what this rubric is most likely to get wrong. - For each submission, write what the evaluator should return: its expected rank against the others (a band for each dimension, not an exact score), and the specific text in the submission it must cite for that score. We'll test the evaluator based on whether it gets the right rank using the cited reasons. Exact numbers vary between evaluators and are not a fair check. Generate this pack as a set of files with this structure: - `README.md` - for the instructor, containing a full overview of the case, including the underlying dynamics, explanation of the data. An instructor reading this for the first time would understand everything they need to know about running this training exercise. Layer this. Begin with an overview, an explanation of the dynamics, a walkthrough of the data, a list of exercises and what they uncover and how to evaluate them. Then go into the details of how each dataset was generated and what dynamics it reflects. - `case.yaml` - instructor-only source of truth. Everything else is generated from it. - `data/` - for the analyst, containing all documents and datasets to be shared with the analyst. Nothing here (including metadata, hidden sheets, comments, ...) should reveal the dynamics DIRECTLY - `src/` - generator scripts and seeds, so the pack can be rebuilt and re-seeded for the next cohort. Not all `data/` needs to be generatable - some of them can be hand-crafted or downloaded or constructed in any way. - `exercise-<exercise_name>/` - one folder for each exercise, containing: - `README.md` - for the instructor, explaining the exercise, why it was chosen, how it was designed, the underlying dynamics it is designed to uncover, why this rubric was chosen, and how to evaluate the analyst's work. Assume they have read ../README.md and nothing else. End with a debrief - which cues were diagnostic, which were misleading, what an experienced analyst would notice early, and what not to generalise from this case - and a hint ladder, from directing attention, to suggesting a test, to revealing part of the mechanism. - `objective.md` - for the analyst, explaining the task - `rubric.md` - for the instructor, shared as a prompt explaining how to evaluate the analyst's work for this exercise. - `tests/` - `submissions/{01,02,...}.md` - analyst-facing only, neutral names - `expected.md` - what each one tests, expected rank, bands, required citations The evaluator receives `objective.md`, `data/`, the dynamics, `rubric.md`, and ONE submission - never `expected.md` and never a second submission. It scores blind. Rank is derived afterwards by comparing its independent scores. Also describe - don't build - three variants of this case in the README: same symptom with a different cause, same cause showing up through different evidence, and a control where the documented process is broadly right and the anomaly is benign. Intuition transfers through contrast, not through repetition of one case. The aim is not to make the exercise easily solvable - quite the opposite. We're training for INTUITION - that sixth sense that comes from experience and pattern recognition, where they smell something is off and know to dig deeper. Design for this. Hard, though, not unfair. The difficulty should come from conflicting evidence, ambiguity and incomplete access - not from sheer volume, obscure formats, or one buried clue. Run these checks before you finish, and list every one in the README with its result: - Write the perfect path for each exercise: the artifact-by-artifact chain from brief to finding. If you can't write it, it's unfair rather than hard. Rewrite the exercise. - If you think a strong AI agent can solve an exercise one-shot while a human would take hours, the difficulty is either volume/effort (move it into contradiction and ambiguity) or clues that are too loud (make each channel innocent on its own). State and fix it. Generate the actual files, not descriptions of them. Report which checks you ran and what failed. Don't say a check passed unless you ran it. Use the context below to create the training pack. Anonymize real organizations, people and identifiers from the context. This context may not be directly related to the training pack. It may contain irrelevant details, objectives, tasks, etc. Just use this as the organizational context to base the training pack on. <CONTEXT> </CONTEXT>
My most memorable anniversary

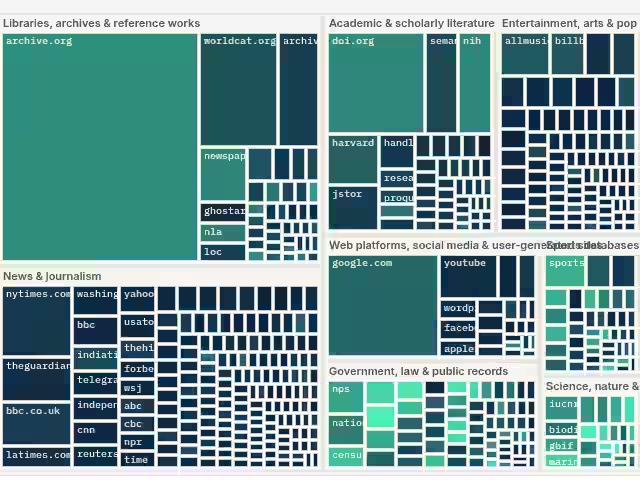
At 9:30 pm, I checked my calendar for tomorrow’s appointments, alt-tabbed frantically into ChatGPT, and started typing: Tomorrow is my 24th anniversary. It’s a bit late for me to buy anything (except maybe an online service) or prepare something. This has become a habit – leaving things to the last minute and asking ChatGPT to save my day. I did give it good context, though. You remember the OCBC expenses treemap you created by analyzing my transactions? That will give you a good guessable idea of the kinds of things she spends on and hopefully, therefore, what she likes. ...

Can AI Replace Human Paper Reviewers?

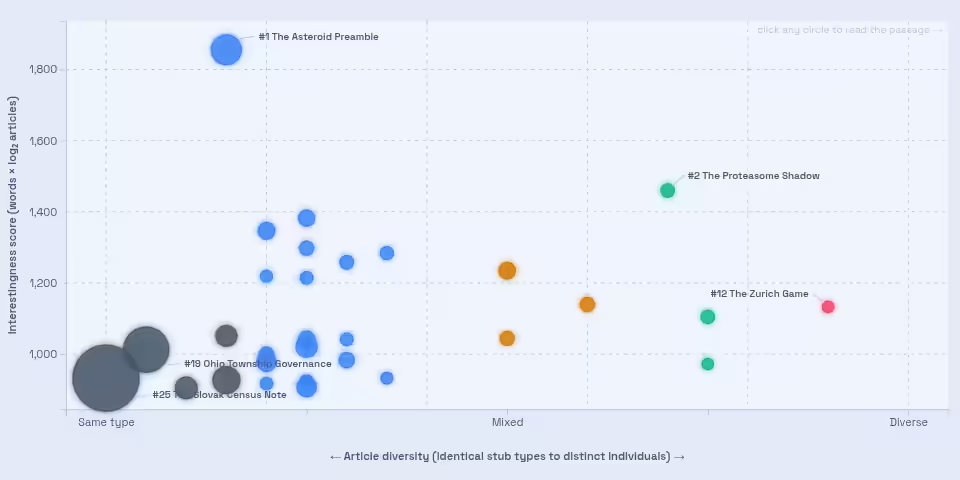
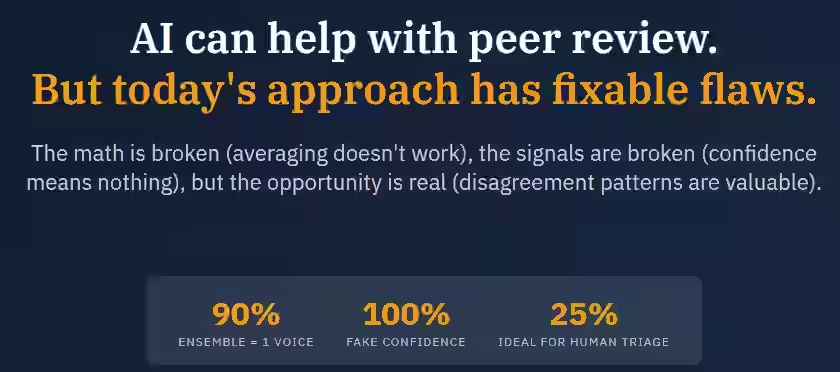
Stanford ran a conference called Agents for Science. It’s a conference for AI-authored papers, peer reviewed by AI. They ran three different AI systems on every paper submitted, alongside some human reviewers. The details of each of the 315 papers and review are available on OpenReview. I asked Codex to scrape the data, ChatGPT to analyze it, and Claude to render it as slides. The results are interesting! I think they’re also a reasonably good summary of the current state of using AI for peer review. ...

2025 4

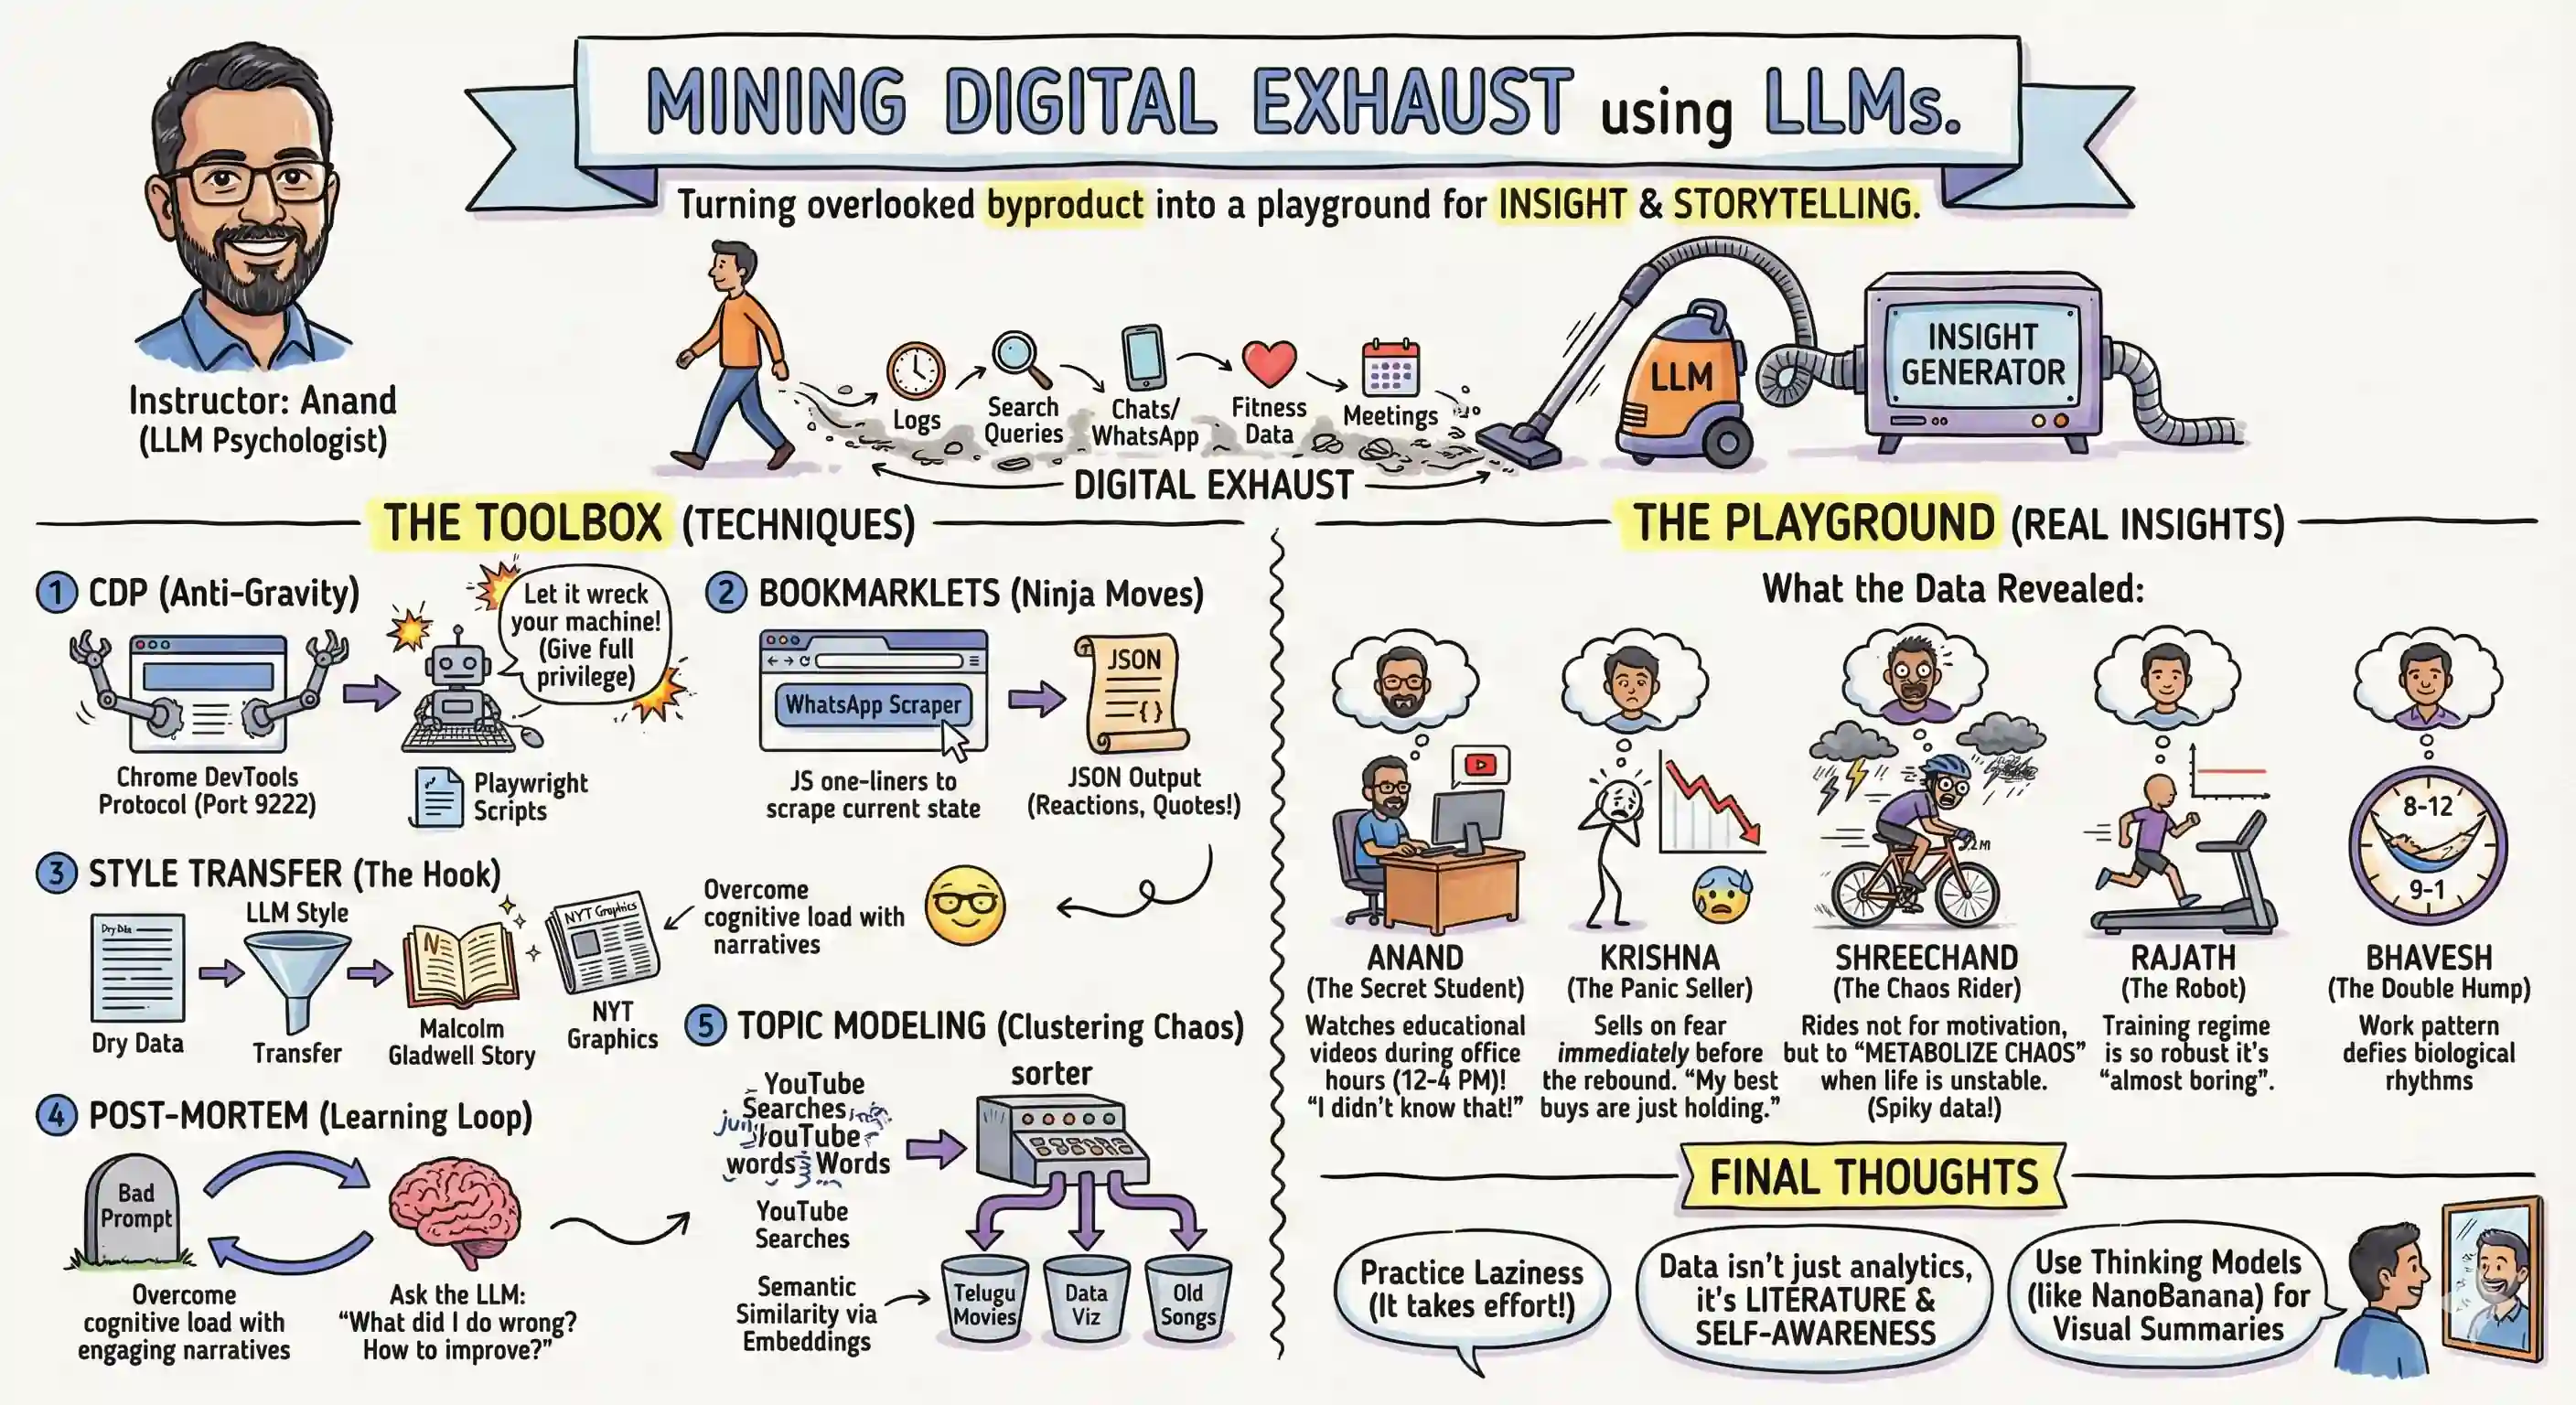
In my Mining Digital Exhaust workshop on Saturday, One discovered that they cycle when life is unstable, not for fitness. Another found that their buys are good but sells are bad trades. I learnt that I watch YouTube most at office (12-4 pm), not at home. How? A fairly straight-forward process: Export your personal data. (Use Chrome Devtools Protocol to scrape.) Upload to ChatGPT, Gemini, Claude, … and have them analyze with code. Have them narrate in the style of your favorite author. Models are super smart, but everyone has equal access to them. Your personal data is unique. Combine them to get something powerful. ...

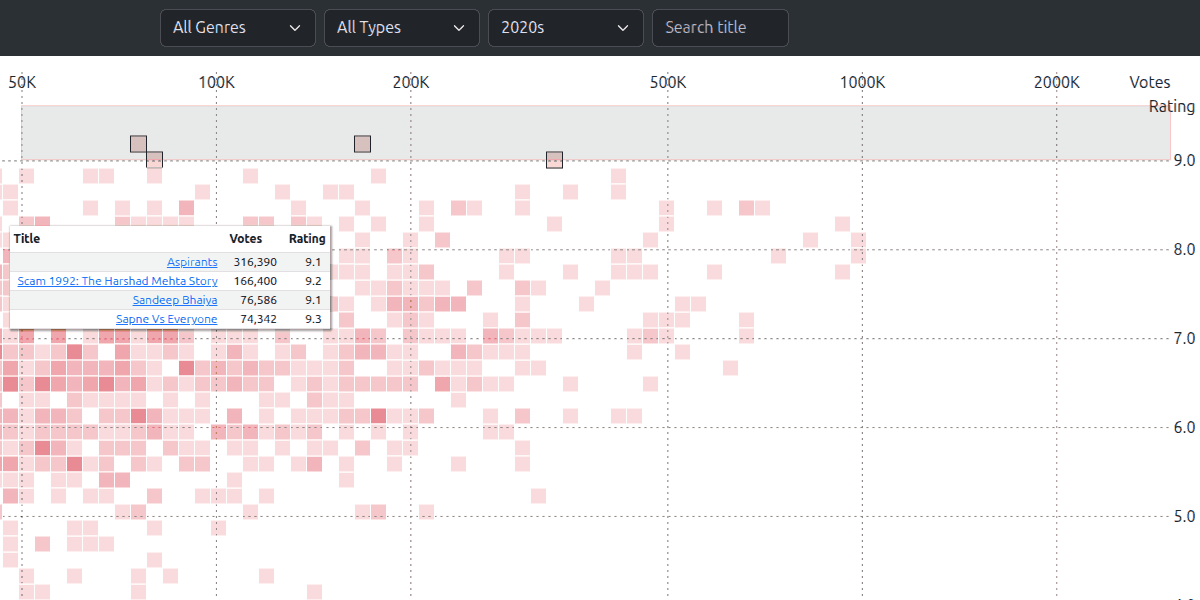
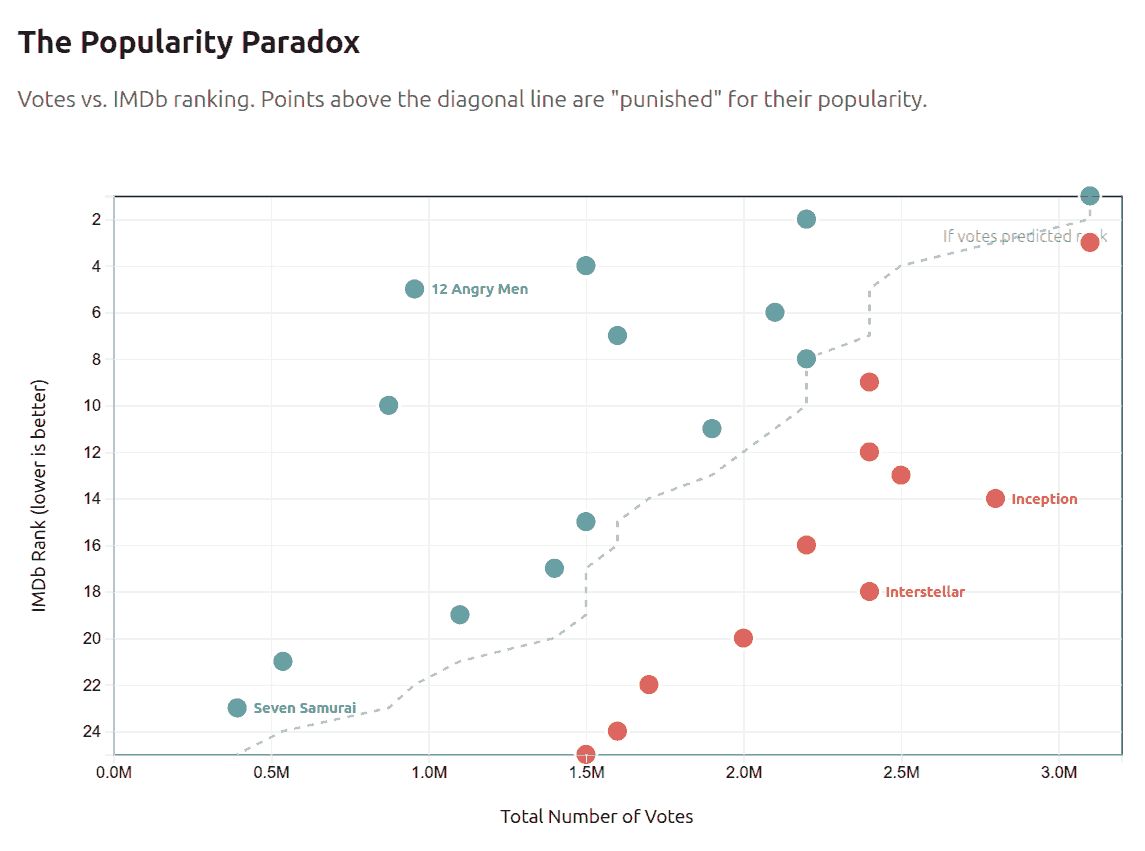
I always wondered why old movies are rated so high on IMDb. For example, 12 Angry Men (1954) with just ~900K votes ranks about as high as Inception (2010) with ~2M votes. Few people I know have seen 12 Angry Men. So where does this high rating come from? My theories were: Old movies really are that good. IMDb’s algorithm is biased towards old movies. People remember older movies fondly. Actually, it’s none of these. It’s selection bias. ...

This talk is an experiment. I am going to talk (literally) to ChatGPT on stage and have it do every kind of data analysis and visual storytelling I have ever done. Bangalore. 27 June. Of course, this is an LLM era away. So no promises. We might be doing something completely different on stage. LinkedIn

I’m at an open Hyderabad meet-up, Thu 20 Mar 4 pm. “Analyzing data with AI agents”." It’s a public event by Hasgeek. Venue: Castlight Health, Sattva Knowledge Park. We know LLMs suck at number crunching but are good with code. I’ll share what we’ve learnt by getting it to write code to analyze data instead. Less lecturing, more interactive Q&A and demos in a cozy group. Mostly for analysts, data scientists, and programmers. Not so much for LLM researchers or managers. ...

2022 3

Old songs in my music library

My music library has around 1,000 songs (mostly Tamil and Hindi, with some Telugu and English film songs). I spent this morning tagging them by year with mp3tag. (Manually. You don’t automate the pleasures of life.) I thought my 1990s collection would be the largest. I was in college, listening to lots of music then. But surprisingly, my collection has grown post the 1990s. ...

How to find a Chinese actor to cast in Hollywood

Film actors mostly act within their own industry. For example, Hollywood actors act outside Hollywood just 10% of the time. Chinese actors act with non-Chinese actors just 1% of the time. So, if you’re a Hollywood producer trying to cast a Chinese actor, how would you find them? One way is to list Chinese actors with the largest number of Hollywood co-stars. Let’s see who tops that list. ...

How isolated is Bollywood from world cinema?

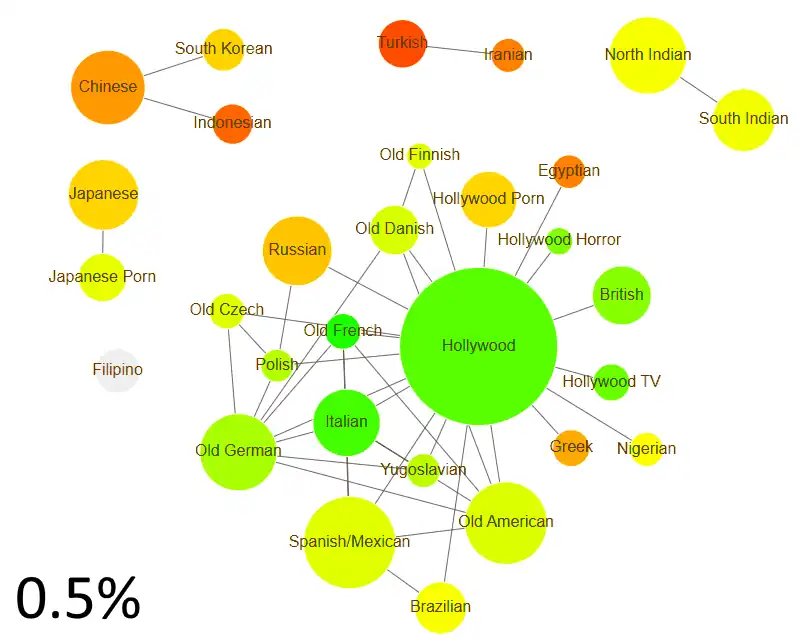
These are the major group actors based on who they act with most. Language. Not country. For example, the Spanish / Mexican group is across countries. But Indian actors divide into North Indian and South Indian. It’s language, not country. Time period. Old American actors are a separate group from Hollywood. (Naturally. Brad Pitt was born after Humphrey Bogart died. They couldn’t have acted together.) Genre. Hollywood Porn actors don’t act with mainstream Hollywood. Same with Japanese Porn, Hollywood TV, and Hollywood Horror actors. How are these groups themselves connected? Do Chinese actors act with Hollywood often? How isolated is Bollywood from world cinema? ...

2021 2

Can foreigners break into #Hollywood? A break into films is hard. Particularly when you’re a foreigner. But is Hollywood more open or less open than other countries? If we go by iconic actors, the numbers are not encouraging. Just 2% of Will Smith’s co-stars are non-Hollywood. But over 30% of Jackie Chan’s co-stars are non-Chinese. But #clustering shows that Hollywood is actually among the most open to foreigners. #dataanalysis Read more at https://www.s-anand.net/blog/can-foreigners-enter-hollywood/ ...

Can foreigners enter Hollywood?

An aspiring Malaysian actor posted on Reddit: I am a 18-year old biracial Malaysian kid who wants to be an actor in Hollywood. I’m taking a diploma for performing arts in a college called Sunway University in 8 days and I’m considering pulling out of it because why do something that I like when my dreams might never be fulfilled and the price for taking this diploma is seriously expensive. I am starting to doubt my chances of making it to Hollywood and I suffer from extreme anxiety. Is it possible for someone like me to enter Hollywood? What are my chances? ...

2020 1

2 inches will change my life

I walked ~11 million steps in the last 3 years, at ~10K steps daily. Since 1 Jan 2018, I've steadily increased my walking average until Aug 2018. Then my legs started aching. So I cut it down until Jan 2019. In Feb, I resumed and was fairly steady until May 2020. To complement workouts like this, products that are aimed for men over 50 can be used. In May, my wife refused to let me walk for more than an hour a day. It took me a few months to convince her and level up. I ended 2020 averaging a little over 10K steps for the year. ...

2015 1

Dissecting my Airtel bills

My monthly postpaid mobile bills have been in the Rs 2,000 – Rs 3,000 range for some time now, and I spent a few hours dissecting them yesterday. Page 3 had the good stuff. It’s a little hard to figure out, but what the last 2 columns say is that most of my spend is offset by discounts. What’s not getting offset are outgoing roaming calls. Followed by calls to local landlines. For all practical purposes, that’s the only thing that counts in this bill. Everything else is close enough to zero. ...

2012 1

Storytelling: Part 1

In a number of sessions I’ve been to, people ask analysts to make their results more interesting – to tell stories with them. I’m co-teaching a course, part of which involves telling stories with data. So this got me thinking: what is a story? How does one teach storytelling to, let’s say, an alien? Consider this mini-paper. ABSTRACT: Meter readings exhibit spikes at slab boundaries. We also find significant evidence of improbably events at round numbers. Electricity shortage is a serious problem in most Indian states. Part of this problem is due to the inaccuracy of reporting procedures used in monitoring meter readings. Our focus here is not to document or experimentally determine the degree of inaccuracy. We have adopted a data driven approach to this problem and attempt to model the extent of inaccuracy using basic statistical analysis techniques such as histograms and the comparison of means. Our dataset comprises of the frequency analysis 12-month dataset containing monthly meter readings of 1.8 million customers in the State of Andhra Pradesh. We find that a histogram of these readings shows unexpectedly high values at the slab boundaries: 50 (+45.342%, t > 13.431), 100 (+55.134%, t > 16.384), 200 (+33.341%, t > 15.232), and 300 (+42.138%, t > 19.958). We also detected spikes at round numbers: 10 (+15.341%, t > 5.315), 20 (+18.576%, t > 6.152), 30 (+11.341%, t > 4.319). The statistical significance of every deviation listed above is over 99.9%. Further, every deviation has a positive mantissa. This leads us to confidently declare the existence of a systematic bias in the meter readings analysed. You’re probably thinking: “I know why he’s put this example here. It must be a bad one. So, what a rotten paper it must be!” ...

2011 1

Birthday matters

Does it matter which month you’re born in? Based on the results of the 20 lakh students taking the Class XII exams at Tamil Nadu over the last 3 years (via Reportbee), it appears that the month you were born in can make a difference of as much as 120 marks out of 1,200 – or 10%! Most students who took the Class XII exams in 2011 were born between March 1991 and June 1992. The average marks of each student (out of 1200) is shown in the graph below. ...

2010 3

What does India search for?

Over the last couple of years, I’ve been tracking the top 5 hot searches in India on Google Trends (http://www.google.co.in/trends). Here are the results: If you're interested in making visualisations out of it, please feel free. But there's one particular thing I'm trying out, which is to categorise these searches and see if there's a trend around that. I've added a "Tag" column. Could you please help me tag the spreadsheet: https://spreadsheets.google.com/ccc?key=0Av599tR_jVYgdE5zTU5QWjcxVWVCaTBuY3d0NkUtc1E&hl=en_GB It’s publicly editable, no special access required. If you could stick to the tags I already have (Business, Education, Entertainment, News, Politics, Sports, Technology), that would be great. If not, that’s fine as well. And if you’ve made any visualisations or done any analysis using this data, please do drop a comment. ...

Shortening sentences

When writing Mixamail, I wanted tweets automatically shortened to 140 characters – but in the most readable manner. Some steps are obvious. Removing redundant spaces, for example. And URL shortening. I use bit.ly because it has an API. I’ll switch to Goo.gl, once theirs is out. I tried a few more strategies: Replace words with short forms. “u” for “you”, “&” for and, etc. Remove articles – a, an, the Remove optional punctuation – comma, semicolon, colon and quotes, in particular Replace “one” with “1”, “to” or “too” with 2, etc. “Before” becomes “Be4”, for example Remove spaces after punctuations. So “a, b” becomes “a,b” – the space after the comma is removed Remove vowels in the middle. nglsh s lgbl wtht vwls. How did they pan out? I tested out these on the English sentences on the Tanaka Corpus, which has about 150,000 sentences. (No, they’re not typical tweets, but hey…). By just doing these, independently, here is the percentage reduction in the size of text: ...

Bayes’ Theorem

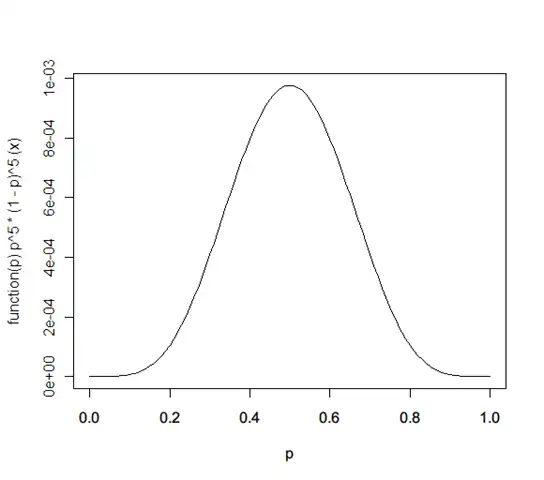
I’ve tried understanding Bayes’ Theorem several times. I’ve always managed to get confused. Specifically, I’ve always wondered why it’s better than simply using the average estimate from the past. So here’s a little attempt to jog my memory the next time I forget. Q: A coin shows 5 heads when tossed 10 times. What’s the probability of a heads? A: It’s not 0.5. That’s the most likely estimate. The probability distribution is actually: ...

2006 7

Enron email analysis

1.5 million internal e-mails of Enron were released after it collapsed, to help figure out why. The UC Berkeley Enron Email Analysis Project has some links analysing these emails. Check out the visual analysis. Comments Prakash Ayer 9 Oct 2006 3:03 pm: Hi Anand, Did you mean Enron instead of Amazon here? Take Care S Anand 9 Oct 2006 3:15 pm: Gosh, yes – sorry, typo on my side. (Wonder why that happened… must’ve been sleep-typing :-) Ravi 16 Oct 2006 6:51 pm: Along the same network visualization lines, http://www.touchgraph.com/TGGoogleBrowser.html and http://liveplasma.com/ are pretty interesting too. Or if you like Digg, http://labs.digg.com/swarm/ works too. (drop me a line some time Anand - kumar (pulli) venkateswar (at) gmail (pulli) com) Irrexu 27 Oct 2006 5:06 am: Long time since you’ve posted any article on your site.. Anand, just a suggestion though.. I think you should start writing more about yourself and the latest in your life.. I am sure there are a lot of takers for that like me. Cheers!

More Google services

Google launches Google Co-op, which lets you search deep content (and share deep content), and Google Trends, which is like Google Zeitgeist for your searches.

Why is nanotechnology popular now

Why is nanotechnology in the top Google queries from India? Comments ravi 15 Apr 2006 10:48 am: from all countries in the list indians are the only one with something technical in their queries. hurrah for that Prabhu 17 Apr 2006 6:03 am: Could be due to the fact that Sujatha is writing an article about it in a tamil weekly S Anand 17 Apr 2006 7:37 am: If so, Tamil Nadu would have to be a big chunk of India’s Google searches. Given the absense of other Tamil queries, I doubt this was the only factor… but it sure must have contributed! Gautam 26 Apr 2006 6:05 pm: funny how sania mirza ranks over aishwarya, though !

IMDB Top 250 outliers

On the IMDb top 250, you normally see a correlation between the number of votes and the rating for a movie. Better rated movies are more watched. The outliers are interesting. The movies that are popular despite not having a high rating are: The Matrix The Sixth Sense Gladiator Star Wars 3: Revenge of the Sith Pirates of the Caribbean I can understand why The Sixth Sense, Pirates of the Caribbean and especially The Matrix are on this list – geeks would have watched these and voted on IMDb, though their voting need not have been high. But why are Gladiator and Sixth Sense on that list? ...

Americans have more leisure time than before

Americans have more leisure time than before. But why do Americans feel so harried? Weirdly, prosperity may be to blame in two ways. First, thanks to rising real incomes, an American’s time is worth more now. A walk in the park is more expensive than it used to be. (When people complain to him about being too busy, Mr Hamermesh tells them that their real problem is too much money.) ...

Google web authoring statistics

Google web authoring statistics. An analysis of over a billion pages to see how people use HTML markup.

Python vs Perl

Python vs Perl. Sums up my feelings perfectly: Python may be better for larger projects, but for my meddling, I’ll stick to Perl. It’s served me well for 10 years. Until 1999, I used Perl a fair bit, but no more than Java or C or anything else. My first “real-life” use of Perl was in 2000, when I was processing 600MB of IBES data. Access and SPSS couldn’t handle the load. Perl slurped all the data in a few seconds, though. A few years later, when processing bank data (3GB worth, this time), Perl again was the only saviour. In fact, between Excel and Perl (and CPAN), I think I have all the data analysis power I’ve ever needed. This blog, for instance, is written in an Excel spreadsheet, exported to XML, and converted into the blog format by Perl.

2005 2

Are the free Mac Minis for real

Are the free Mac Minis for real? Hardy tries to get one – and succeeds. But… is it worth it? Pretty good economic analysis.

Freakonomics at Google

The authors of Freakonomics visited Google, and were asked “What would you do with our data?” BTW, there is a regular Freakonomics column on the Times.

2002 1

Music helps identify software bugs

Music helps identify software bugs. I’m sure it can be extended to many other forms of ordered data. DNA sequences, time series, etc.