2009 1

Motion charts in Excel

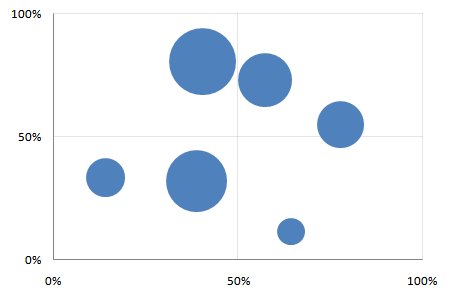
Creating motion charts in Excel is a simple four-step process. Get the data in a tabular format with the columns [date, item, x, y, size] Make a “today” cell, and create a lookup table for “today” Make a bubble chart with that lookup table Add a scroll bar and a play button linked to the “today” cell For the impatient, here’s a motion chart spreadsheet that you can tailor to your needs. For the patient and the puzzled, here’s a quick introduction to bubble and motion charts. ...
2008 1

Animated charts in Excel

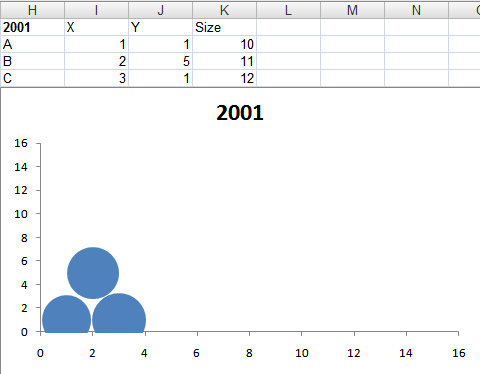
Watch Hans Rosling's TED Talks on debunking third world myths and new insights on poverty and ask yourself: could I do this with my own data? Yes. Google has a gadget called MotionChart that lets you do this. Now, you could put this up on your web page, but that's not quite useful when presenting to a client. (It is shocking, but there are many practical problems getting an Internet connection at a client site. The room doesn't have a connection. The cable isn't long enough. You can't access the LAN. Their proxy requires authentication. The connection is too slow. Whatever.) ...

2005 1

Excel - Avoid manual labour 2

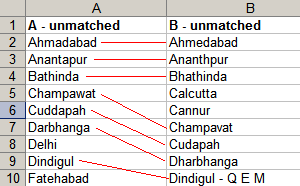
Rule #3: Avoid manual labour (continued) Reconciling data is where I spend most of my time on Excel. Say you have a list of branches by city from 2 banks. You want to know where both banks have branches. Excel doesn’t know that Kolkata is Calcutta. There are 500 cities, and you have 30 minutes. Use VLOOKUP for a start. If Bank A’s cities are in column A (say 2-500) and Bank B’s cities in column B (say 2-400), in C2 type VLOOKUP(A2, B$2:B$400, 1, 0) (read Excel help – all I’ll say is, don’t miss out the 0 at the end: otherwise you get approximate match, and that’s not good). Copy the formula to down to C500. Similarly, in D2 type VLOOKUP(B2, A$2:A$500, 1, 0). Copy the formula down to D400. ...