Turning iPod into a universal remote
Turning iPod into a universal remote.
Turning iPod into a universal remote.
Google Feed API to be released soon. While on Google, there’s some rumour about Google Purchases being used for video rentals – and eventually on to micropayments, competing with Paypal. Also, William Slawski maps Google’s acquisitions. Comments Ashwin 1 Jan 2006 3:13 pm: Anand, you have a similar look of Prasanna. (Hero of Tamil film: Kanda Naal Mudhal) S Anand 2 Jan 2006 11:25 am: Gosh, thanks! :-)
My Calvin and Hobbes index is current up to June 1990. Comments Sathya 28 Dec 2005 3:23 am: Are you manually typing all these stuff ? Ammadiyov … why dont u outsource such stuff :-) S Anand 28 Dec 2005 8:04 am: Whom to? :-) ritzkini 28 Dec 2005 8:32 am: !!! :O all by yourself !!?? crazy about C&H,eh ? S Anand 28 Dec 2005 10:55 am: Completely. And I’m not the only one I know either! vikram 29 Dec 2005 12:03 am: wow awesome man! i’m crazy about C&H too. great work man. :) Sathya 30 Dec 2005 3:25 am: Now you know whom to outsource to ;-P S Anand 30 Dec 2005 10:43 am: Hey, my index vanished! S Anand 30 Dec 2005 10:24 pm: It’s back. Madhu 5 Jan 2006 7:57 am: Did you try the Calvin Hobbes entire collection for their 20th Anniversary. Its about 5k in India. S Anand 5 Jan 2006 6:00 pm: Very tempting! Anonymous 9 Jan 2006 8:07 am: i have an internet link to the complete c&h, let me know if you would like iy S Anand 10 Jan 2006 9:08 am: Is it in text? I’d really like the complete Calvin in TEXT. S Anand 11 Jan 2006 11:16 am: Calvin theme subjects. Madhu 18 Jan 2006 9:53 am: Let me help you with this. I will work on Calvin and Hobbes backwards from 31-12-95 and see where I can reach S Anand 18 Jan 2006 10:52 am: Thanks, Madhu! That’ll be wonderful. Someone else I know in Germany working backwards from 31-12-95. How about if you take it forward from 01-01-93? JustSomebody 3 Apr 2010 5:17 am: Excuse me, but I think this strip search is broken. For some reason, it only has comics up to July 31, 1988. All the other comics aren’t showing and the text is replaced with jibberish. S Anand 3 Apr 2010 8:02 am: Yes – thanks for pointing this out. Fixed it now. The Calvin and Hobbes search Takedown | s-anand.net 21 May 2010 12:02 pm (pingback): […] bit puzzled, but just added it to my list of eccentricities and carried on. I was halfway there in 2005, pushed further in 2006, and with some help, I managed to finally complete […]
Good and bad procrastination by Paul Graham. The most impressive people I know are all terrible procrastinators. So could it be that procrastination isn’t always bad?
Why spaghetti does not break in half. It usually breaks into three or more pieces. Audoly and Neukirch show several videos of this phenomenon. The also show that dry spaghetti breaks even if you just bend it, and release it suddenly. This is because the waves of curvature propogate through the spaghetti, and sometimes the curvature becomes too high. When you break spaghetti, it first breaks into two, and then the remaining halves behave as if they were released suddenly, splitting into further pieces.
Top 10 IT Google Videos.
Google Video Downloader. Comments Madhu 5 Jan 2006 8:40 am: Have you tried www.youtube.com Google will probably take it over! S Anand 5 Jan 2006 6:00 pm: I use it. But why would Google take over? They already have a pretty good service… Madhu 6 Jan 2006 12:11 pm: Why not? MSN will take over otherwise. shekar 14 Jan 2006 11:06 pm: s anand, I saw your Swindon vidoes. They are edited very well. What software did you use? Especially the blue first screen. S Anand 14 Jan 2006 11:31 pm: Microsoft Movie Maker. It came bundled with Windows XP on my office laptop.
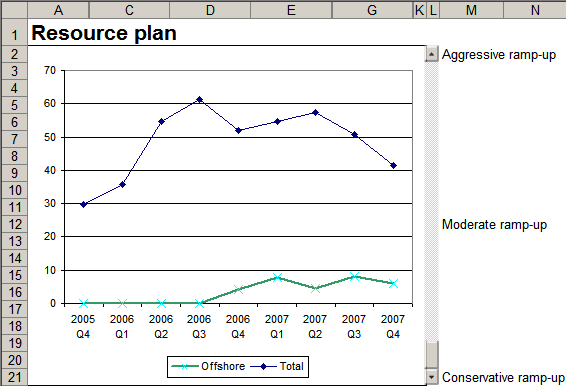
Rule #4: Make your model visually obvious. After years of creating Excel models with lots of inputs and lots of outputs, I’ve learnt two things. Usually, only ONE input parameter matters. Think of this as being the constraint in the Theory of Constraints, or the principal component in factor analysis. You want your model to communicate the impact of the ONE parameter, and get a decision based on that. Keep the rest at their best default value. ...
A few tips, without getting into the details. Array formulas let you perform any calculation on an entire list, and get the result in a single formula. Database functions like DSUM can manipulate tables of data very flexibly. Using these and Pivot tables, you can do anything with any tabular data. Comments Ananth 22 Dec 2005 6:32 am: I needed your feedback on www.doondo.org. Give it a spin let me know. I wanted to avoid positng here but never got any replies for the mails sent at root_node at yahoo.com Ananth 22 Dec 2005 6:33 am: www.doondo.org is a hobby project I’ve been working on. The beta is just out. Ananth 22 Dec 2005 6:35 am: Looking forward for your views and feedback ritzkini 22 Dec 2005 10:01 am: great concept ananth..shld be a hit considering the great response to a similar funda used in IIM-I’s Klueless S Anand 22 Dec 2005 12:31 pm: I liked the concept and interface, Ananth. Will mail you in detail. Quick question… how do I find out what the right keywords are? ritzkini 23 Dec 2005 2:19 am: hehehe…hey anand,saw the visitor stats thing for the first time today ! awesomely cool ,kudos! u did it yourself ?? Dhar 23 Dec 2005 3:26 am: Ananth, does your game support advanced Google operators? Ananth 23 Dec 2005 4:11 am: Thanks for feedback folks. doondo needs additional features, like game summary with right keywords. Right now only basic operators are supported. Even such a simple concept requires complex coding skills! I would love if you can post the suggestion at [email protected]. Great if you can join the group. Anand wouldn’t like spamming his comments section with doondo. S Anand 24 Dec 2005 1:42 am: Yeah ritzkini, spent a week coding the visitor stats. What else do you think would be useful to see? ritzkini 26 Dec 2005 7:22 am: :) i dont think it could have been any more comprehensive than it already is ! :) harish 11 Jan 2006 3:50 am: great work mate…
Debugging in Excel is another time consuming task. 80% of the trouble is identifying the problem (Error? What error? Where?) as opposed to fixing it (Why’s THAT cell showing THAT?). Most of my time is spent chasing three kinds of errors: wrong reference (leading to a #N/A or #REF!), wrong data input, or wrong formula. Wrong references are easy to spot. You’ll see a #N/A or a #REF! sticking out. But on large sheets, even that’s tough to spot. I always have a SUM (or some kind of total) function that covers EVERY cell in EVERY table, even if I don’t need that information. If ther SUM shows a #N/A or #REF!, I can use Trace Error (Alt-T-U-E) to see where the problem is coming from. ...
Site Helper: simple instructions on how to get a web site up and running.
Paris by night. A panorama of Paris.
Most blogged books of 2005.
Are the free Mac Minis for real? Hardy tries to get one – and succeeds. But… is it worth it? Pretty good economic analysis.
So I have a blog is Sir Tim Berners-Lee’s blog. The comments on the first post pay homage to the father of the WWW. via LazyGeek
Powers of Ten, a video for IBM zooming 10 times every 10 seconds through the universe.
Convert PDF to HTML via Gmail. This is the only way I know of converting something from PDF into another format. Unfortunately, it doesn’t work for GoogleMail in the UK.
Tech support tricks of the trade. This one is very true. And I used to think computers just started working better when I was around…
Hilarious anecdotes from an American teacher in Japan. Comments Anonymous 22 Dec 2005 8:51 am: Good stuff Anand - and great placement of the link on Anecdotes - needed it after the example on leasing !!
Google Music Search and the Home Page API. With the home page API, Google Base, and Blogger, looks like Google has bypassed conventional web hosting and become a Web 2.0 host.