2013 1

Geocoding in Excel

It’s easy to convert addresses into latitudes and longitudes into addresses in Excel. Here’s the Github project with a downloadable Excel file. This is via Visual Basic code for a GoogleGeocode function that geocodes addresses. Function GoogleGeocode(address As String) As String Dim xDoc As New MSXML2.DOMDocument xDoc.async = False xDoc.Load ("http://maps.googleapis.com/maps/api/geocode/" + _ "xml?address=" + address + "&sensor=false") If xDoc.parseError.ErrorCode <> 0 Then GoogleGeocode = xDoc.parseError.reason Else xDoc.setProperty "SelectionLanguage", "XPath" lat = xDoc.SelectSingleNode("//lat").Text lng = xDoc.SelectSingleNode("//lng").Text GoogleGeocode = lat & "," & lng End If End Function Comments Ryan 8 Jun 2015 9:28 pm: I find this isn’t working and says, Compile Error; User defined type not defined xDoc As New MSXML2.DOMDocument what do I change to fix it? Thank you Richie Lionell 27 Jul 2016 6:40 am: Ryan, Inside the VBE, Go to Tools -> References, then Select Microsoft XML, v6.0 . If that doesn’t work unselect that and select Microsoft XML, v3.0
2009 2

Automating PowerPoint with Python

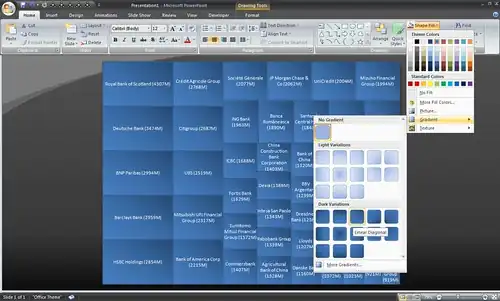
Writing a program to draw or change slides is sometimes easier than doing it manually. To change all fonts on a presentation to Arial, for example, you’d write this Visual Basic macro: Sub Arial() For Each Slide In ActivePresentation.Slides For Each Shape In Slide.Shapes Shape.TextFrame.TextRange.Font.Name = "Arial" Next Next End Sub If you didn’t like Visual Basic, though, you could write the same thing in Python: import win32com.client, sys Application = win32com.client.Dispatch("PowerPoint.Application") Application.Visible = True Presentation = Application.Presentations.Open(sys.argv[1]) for Slide in Presentation.Slides: for Shape in Slide.Shapes: Shape.TextFrame.TextRange.Font.Name = "Arial" Presentation.Save() Application.Quit() Save this as arial.py and type “arial.py some.ppt” to convert some.ppt into Arial. ...

Motion charts in Excel

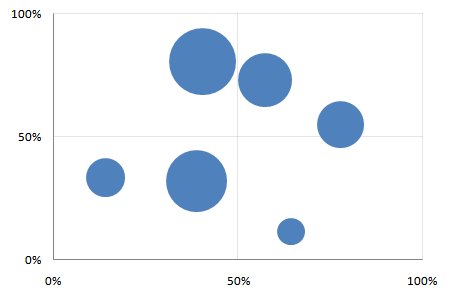
Creating motion charts in Excel is a simple four-step process. Get the data in a tabular format with the columns [date, item, x, y, size] Make a “today” cell, and create a lookup table for “today” Make a bubble chart with that lookup table Add a scroll bar and a play button linked to the “today” cell For the impatient, here’s a motion chart spreadsheet that you can tailor to your needs. For the patient and the puzzled, here’s a quick introduction to bubble and motion charts. ...

2007 3

RSS feeds in Excel

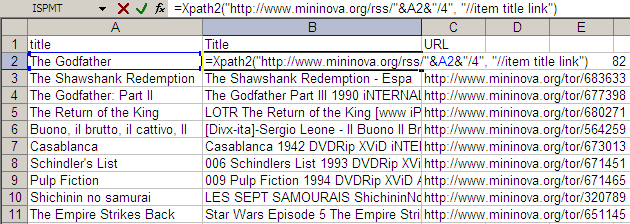
The technique of Web lookups in Excel I described yesterday is very versatile. I will be running through some of the practical uses it can be put to over the next few days TO generalise things beyond just getting the Amazon price, I created a user-defined function called XPATH. It takes two parameters: URL of the XML feed to read Search XPath list string (separated by spaces) This function can be used to extract information out of any XML file on the Web and get it out as a table. For example, if you wanted to watch the Top 10 movies on the IMDb Top 250, and were looking for torrents, an RSS feed is available from mininova. The URL http://www.mininova.org/rss/movie_name/4 gives you an RSS file matching all movies with “movie_name”. From this, we need to extract the and <item><link> elements. That’s represented by “//item title link” on my search string. ...

Web lookup using Excel

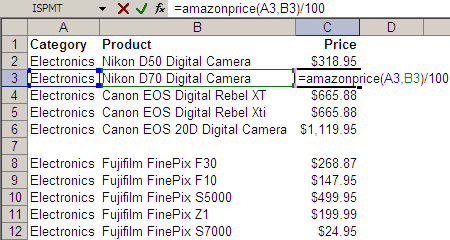
Take a look at the Excel screenshot below. Yes, that’s right. I have a user-defined function called AMAZONPRICE. And it returns these cameras’ prices directly from Amazon.com. (Given the category and some keywords, it returns the price of the bestselling item on Amazon.com.) Here’s the code behind the function. Function AmazonPrice(index As String, keywords As String) As String Dim xDoc As MSXML2.DOMDocument30 Set xDoc = New MSXML2.DOMDocument30 xDoc.async = False If xDoc.Load("http://ecs.amazonaws.com/onca/xml?Service=AWSECommerceService" _ "&Version=2005-03-23&Operation=ItemSearch&SubscriptionId=03SDGQDFEB455W53SB82" _ "&AssociateTag=sanand-20&MinimumPrice=10000&ResponseGroup=OfferSummary,Small" _ "&Sort=salesrank&SearchIndex=" & index & "&Keywords=" & keywords) Then xDoc.setProperty "SelectionLanguage", "XPath" xDoc.setProperty "SelectionNamespaces", _ "xmlns:a=""http://webservices.amazon.com/AWSECommerceService/2005-03-23""" AmazonPrice = xDoc.selectSingleNode("/a:ItemSearchResponse//a:Amount").Text End If End Function This is how it all started… ...

User defined array functions in Excel

Many languages have functions to process lists (array). These functions usually return a list, so you can pass that to another list function. This chaining of functions is really powerful. UNIX provides this sort of chaining capability. If I had a cities (with some repetitions) and I wanted to find out how many started with the letter ‘A’, I’d just type: cat cities | sort | uniq | grep "^A" | wc cat: types the cities. sort: sorts the cities alphabetically. uniq: finds unique cities (works only if sorted - that's why we had to sort the list). grep: filters the cities. Only allows cities beginning with A. wc: word count To do this on Excel, the only way is to ...

2006 2

User-defined functions to get cell formatting

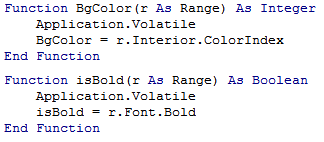
Sometimes you want to check the colour of a cell, or whether a cell is bold. This can be easily done with user-defined functions (UDFs). (To create a UDF, press Alt-F11, Alt-I-M, and type the code below.) You can use ISBOLD(cell) to check if a cell is bold, and BGCOLOR(cell) to get the background colour of the cell. This lets you selectively process bold or shaded cells. The two examples below show how you can add only the cells in bold, or only the shaded cells. ...

User-defined functions in Excel

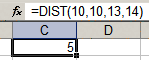
Excel lets you create your own functions. If you wanted to create a function that returned the distance between two points (x1,y1) and (x2,y2), you can create a function DIST that takes these 4 parameters, and use it as shown below. To create such a function, press Alt-F11 to open the Visual Basic Editor insert a new module (Alt-I-M) type the following code: ...

2005 1

Excel - Make your model visually obvious


Rule #4: Make your model visually obvious. After years of creating Excel models with lots of inputs and lots of outputs, I’ve learnt two things. Usually, only ONE input parameter matters. Think of this as being the constraint in the Theory of Constraints, or the principal component in factor analysis. You want your model to communicate the impact of the ONE parameter, and get a decision based on that. Keep the rest at their best default value. ...