2026 3

Case Study

Create a training pack to help analysts (business analysts, data scientists, strategy consultants, forward deployed engineers, etc.) improve their investigative judgment. Success for the analyst is not recovering the hidden truth you designed. It is making the best evidence-based judgment available from the materials. Design and score for that. First, formulate the underlying dynamics - the hidden mechanisms, reasons, processes - e.g. - why the processes are not/poorly/wrongly documented - why the data is stored, structured, and labelled the way it is - why it has the quality issues that it does - what are the underlying unstated organizational dynamics, etc. Discovering some or all of these would be key to the analyst's success in the exercise. Don't state these dynamics directly anywhere the analyst can see. But they may be partly mentioned, disputed, denied, euphemised, or misunderstood by people who each see only a part of it. That is how it works in real-life. For each dynamic, plan two or more independent channels through which an analyst can detect it (a data pattern, a silence in a thread, a timeline that doesn't line up, a form field abandoned mid-year), and at least one innocent explanation that fits any single channel on its own. Also plant anomalies that mean nothing - in real-life, not everything is a clue, and we want to train for the intuition to tell the difference. Create an instructor-only `case.yaml` that includes all of this as the primary context. Include entities, systems, timeline, people, the process (how was it designed, documented, believed to run, actually runs), the dynamics and where and how each dynamic plays a role. Record every anomaly in the pack in case.yaml, marked as: designed and critical / ambient noise / benign quirk / accidental defect. Fix the accidental defects. Generate every artifact below from `case.yaml` to avoid ACCIDENTAL contradictions. Create realistic documents and datasets that an analyst will likely get when investigating a process like below. This includes: - Documents explaining the process. Reflect real-life, where some processes are undocumented, poorly documented, or wrongly documented. - Datasets. - Both structured (spreadsheets, SQL dumps, geospatial, proprietary formats, ...) and unstructured (text, images, documents with a mix, audio, video, ...). - This may include large transactional/reference data as well as smaller datasets, across a variety of realistic formats. - Think about how organizations realistically store data. There are underlying historical and organizational reasons for why their data evolved the way it did. In real-life, datasets have varying quality, based on the process of collecting and processing them. Datasets are often sourced from multiple systems and processes. The nature of gaps / errors / other quality attributes typically reflect the underlying sources. - Use a format only if this organization would likely produce it and it serves an exercise - not just for variety. - For large transactional data, Use a fake data generator skill when available. Write seeded generator scripts rather than static files. - Supporting material. This may include emails, chat logs, meeting transcripts, system logs, people profiles, etc. that are usually passed to an analyst for context. In real-life, these supporting materials are windows into and reflections of organizational structure, politics, constraints, etc. How it is said, and what is unsaid, is often more important than what is said. - People the analyst can question. Add the profiles to `data/`. Include instructor-only notes explaining what each person knows, believes, is wrong about, and would rather not say. Enough for an instructor (or AI agent) to role-play them and answer questions like them. Deciding whom to ask, and what, is a critical skill. That's how analysts go beyond incomplete / incorrect briefs. The same pack can be used for multiple exercises. Include exercises, each containing: - Objective - a page explaining their task. Realistically, these may be loosely, incompletely, or wrongly defined, or unsolvable without additional data or context, etc. This, too, needs to reflect real-life based on a hidden dynamic. Where the brief is wrongly framed or underdetermined, analysts should reframe it, say what's missing, ask for it, and act safely under uncertainty. If they do that, that's a success, not failure. Don't make something wrong in every objective. Deciding whether to dig is part of the training. Mention who the objective is for, how long it should take, which tools (e.g. AI agents) are allowed, and what output to submit. Require an evidence table - claim | source | confidence - and the hypotheses they rejected, with why. Without this, we can't differentiate between judgment and lucky guesses. Some exercises can be small: one artifact, ten minutes, "does anything here smell wrong?" - including some where the answer is no. Intuition comes from many quick exercises with fast feedback, not just from one long case. - Rubric - not shared with the analyst, but explaining to the instructor: - What the analyst needs to discover in order to succeed in the exercise - mentioning the relevant dynamic. - How to evaluate the analyst's work. Share this as a prompt that can be shared with an expert or an AI agent. The prompt will be shared along with the same inputs passed to the analyst (documents, datasets, supporting material, this exercise's objective) as well as the dynamics. The prompt should clearly explain the steps to evaluate the analyst's work and the scoring rubric along with evaluation criteria and clear definitions of what constitutes a good/bad response, with an emphasis on the hidden dynamics that the analyst needs to discover. Because the evaluator is handed the dynamics, say explicitly: score the evidence and reasoning first, THEN the conclusion. A well-supported alternative conclusion can score as high as the intended one. But the intended conclusion asserted without evidence should not score high. You can use the tone, omissions, timing, and other "non-verbal" aspects of the response as a signal, but treat that as hypotheses needing proof. - Write behavioural anchors for each score level. - Then write test submissions for this exercise, as an analyst would write them - not as someone who knows the answer. For example, if a "good" submission clearly states the dynamic, that's unrealistic. Recommended submissions: 1. Strong: real evidence, traced to files, calibrated, some things still open. 2. Polished but shallow: confident, well written, restates the brief, no evidence. 3. Right conclusion without evidence - a lucky guess. 4. A different conclusion that the evidence actually supports. 5. Says the evidence is insufficient, and asks for the right things. 6. Treats a decoy as a finding. Target what this rubric is most likely to get wrong. - For each submission, write what the evaluator should return: its expected rank against the others (a band for each dimension, not an exact score), and the specific text in the submission it must cite for that score. We'll test the evaluator based on whether it gets the right rank using the cited reasons. Exact numbers vary between evaluators and are not a fair check. Generate this pack as a set of files with this structure: - `README.md` - for the instructor, containing a full overview of the case, including the underlying dynamics, explanation of the data. An instructor reading this for the first time would understand everything they need to know about running this training exercise. Layer this. Begin with an overview, an explanation of the dynamics, a walkthrough of the data, a list of exercises and what they uncover and how to evaluate them. Then go into the details of how each dataset was generated and what dynamics it reflects. - `case.yaml` - instructor-only source of truth. Everything else is generated from it. - `data/` - for the analyst, containing all documents and datasets to be shared with the analyst. Nothing here (including metadata, hidden sheets, comments, ...) should reveal the dynamics DIRECTLY - `src/` - generator scripts and seeds, so the pack can be rebuilt and re-seeded for the next cohort. Not all `data/` needs to be generatable - some of them can be hand-crafted or downloaded or constructed in any way. - `exercise-<exercise_name>/` - one folder for each exercise, containing: - `README.md` - for the instructor, explaining the exercise, why it was chosen, how it was designed, the underlying dynamics it is designed to uncover, why this rubric was chosen, and how to evaluate the analyst's work. Assume they have read ../README.md and nothing else. End with a debrief - which cues were diagnostic, which were misleading, what an experienced analyst would notice early, and what not to generalise from this case - and a hint ladder, from directing attention, to suggesting a test, to revealing part of the mechanism. - `objective.md` - for the analyst, explaining the task - `rubric.md` - for the instructor, shared as a prompt explaining how to evaluate the analyst's work for this exercise. - `tests/` - `submissions/{01,02,...}.md` - analyst-facing only, neutral names - `expected.md` - what each one tests, expected rank, bands, required citations The evaluator receives `objective.md`, `data/`, the dynamics, `rubric.md`, and ONE submission - never `expected.md` and never a second submission. It scores blind. Rank is derived afterwards by comparing its independent scores. Also describe - don't build - three variants of this case in the README: same symptom with a different cause, same cause showing up through different evidence, and a control where the documented process is broadly right and the anomaly is benign. Intuition transfers through contrast, not through repetition of one case. The aim is not to make the exercise easily solvable - quite the opposite. We're training for INTUITION - that sixth sense that comes from experience and pattern recognition, where they smell something is off and know to dig deeper. Design for this. Hard, though, not unfair. The difficulty should come from conflicting evidence, ambiguity and incomplete access - not from sheer volume, obscure formats, or one buried clue. Run these checks before you finish, and list every one in the README with its result: - Write the perfect path for each exercise: the artifact-by-artifact chain from brief to finding. If you can't write it, it's unfair rather than hard. Rewrite the exercise. - If you think a strong AI agent can solve an exercise one-shot while a human would take hours, the difficulty is either volume/effort (move it into contradiction and ambiguity) or clues that are too loud (make each channel innocent on its own). State and fix it. Generate the actual files, not descriptions of them. Report which checks you ran and what failed. Don't say a check passed unless you ran it. Use the context below to create the training pack. Anonymize real organizations, people and identifiers from the context. This context may not be directly related to the training pack. It may contain irrelevant details, objectives, tasks, etc. Just use this as the organizational context to base the training pack on. <CONTEXT> </CONTEXT>
CIO Newsletter

Find the best ideas for my next occasional email to CIOs and senior technology/data leaders. First read and apply these skills on @LocalMCP: expert-lens, ideation-protocol, blind-spot, anand-objectives, decision-compression, evidence-provenance. ## 1. Calibrate the newsletter Using personal Gmail via `gws`, find sent emails from `[email protected]` containing: `you might have hinted you'd like such emails from me` Read the newsletter emails, not merely the matching snippets. Infer: - the audience; - the recurring structure and tone; - what counts as sufficiently important; - topics already covered, so they are not repeated. These are not AI-news roundups. The strongest emails usually begin with something I personally did, observed, measured, decided, or got wrong; provide inspectable evidence; derive one surprising enterprise implication; and give readers something concrete to try or reconsider. ## 2. Search my corpus Search primarily after the latest matching newsletter, while allowing older material that was overlooked. Use a staged search: 1. Scan indexes and recently modified files to identify at most 30 candidate sources. 2. Deep-read at most the 12 richest sources. 3. Re-open the best evidence to verify exact wording, numbers, dates, and provenance. Prioritize: - recent meeting transcripts and notes under `~/Dropbox/notes/` and ``~/Dropbox/notes/transcripts/`; - `~/code/talks/README.md` and linked talks; - `~/code/blog/description.md` and targeted posts; - `~/code/til/README.md`; - `~/code/llmdemos/config.json`; - `~/code/llmevals/README.md`; - email or chat only when it supplies a firsthand incident, reaction, decision, result, or failure. Do not let public AI news become the core idea. Public sources may corroborate my evidence, but cannot substitute for it. ## 3. Gate every candidate Keep an idea only when most of these hold: - **Firsthand:** I did, observed, measured, decided, or materially shaped it. - **Surprising:** it challenges a reasonable CIO assumption. - **Consequential:** it could change an enterprise decision within the next 6–12 months. - **Evidenced:** there is a concrete incident, number, artifact, failure, or audience reaction. - **Exclusive:** a well-read CIO is unlikely to learn most of it from ordinary AI media. - **Emailable:** it supports one focused story: incident → implication → practical move. - **Shareable:** it is public, can be safely anonymized, or is clearly marked as requiring approval. Reject generic trends, secondhand frameworks, routine project updates, unsupported opinions, thin rewrites of earlier newsletters, and impressive claims whose provenance cannot be recovered. Explore broadly before ranking. Include 2–3 `IDEA`s: rich sources that may not yet support a finished thesis but are likely to provoke a better idea. ## 4. Output Return 8–12 ideas, prioritized. For each: 1. **Working title and one-sentence thesis** 2. **Opening incident or evidence** 3. **Why a CIO should care** 4. **Why this is uniquely me** 5. **Sources:** exact path, date, and useful line range or section; mention any public artifact available in the source 6. **Shareability:** PUBLIC / ANONYMIZE / APPROVAL NEEDED 7. **Missing evidence or weakness** 8. **Verdict:** WRITE NEXT / STRONG / IDEA / SKIP Then provide: - the top three in order, explaining why each narrowly beats the next; - one attractive but generic idea rejected; - one strong idea rejected because it is not sufficiently me; - any important corpus area that could not be inspected. Do not draft the newsletter. Be concise, skeptical, and specific. Never invent a result or imply external approval. 27 Jul 2026: Created. ChatGPT

Things I Learned - 22 Mar 2026

This week, I learned: Psychological operations in design by Narendra Ghate When lights are dimmed people speak softer. So, dimming lights reduces sound levels in noisy offices. Rather than reduce the size of shampoo sachets (which customers and business both hate), include 2 shampoos in one sachet, tearable in the middle. Price saches at 95p with a 5p deposit for the sachet - which rag-pickers can collect and return to the retailer. People think of stains like wounds on cloth. So a “stain band-aid” where you stick a strip, and remove it after 5 min to remove the stain, is catchy. A mechanical wind-up fish that stirs the water in the bucket while clothes are soaking speeds up the process. Senthil & Amutha, founders of Payir demonstrated a re-usable fabric calendar that converts into a bag for re-use. Pretty clever! Their message at the Chennai Design Festival was that good design can be for the masses and by the masses to reclaim their time, energy, and joy. The urinary bladder works based on involuntary muscular contractions towards the end, to clear out the last bits of fluid. It’s not fluid flow, it’s muscle contractions. (Oh, the things I learn!) Gemini Indigo bans ghee in cabin baggage. Also coconuts, pickles, oily foods, gooey cakes, spices (masala, powders), strong-smelling food. ChatGPT New skill unlocked: how to demo without knowing what you’re demo-ing. STEP 1: Copy-paste all demo pages as Markdown. STEP 2: Tell AI “Here is a demo I’ll be showing. (Add context.) Tell me how I should explain this and what I should point out as specific examples. Use concise bullets.” We’ve learnt not to do things we don’t know how to (until we learn it). When AI is doing things, this is a bottleneck. Get out of the way. Stop filtering for what YOU can do. Stop learning what IT can do. Ask for it. That’s faster. Learning can come later. I keep forgetting that QR codes need a white border for them to work. TerraDraw provides a unified API across multiple mapping libraries. (In the vibe-coding era, this is not as useful.) To create desktop apps declaratively on Linux, Slint, Flutter, QML(Qt) and GTK4 are options. Slint and Flutter seem to be cross platform. Slint is newer, less mature but compiles to small fast binaries and might be a good option to explore. Flutter seems more mature and fairly popular. Claude PyTorch Tracing watches one forward pass and freezes the path into a portable recipe. But it silently ignores branches your example didn’t take. Claude The Internet is forking into a human internet vs an agent web LinkedIn SamGeo is a Python Package for geospatial image processing. While OlmoEarth provides geospatial embeddings, SamGeo can convert geospatial data to vector data! So you can do things like: Create the outer boundary of all apartments with swimming pools in a city Extract the shape of all lakes across the years to find out how they’re changing. Terence started Foundation for Science and AI Research (SAIR) to use AI in science research. Verifiable proofs (e.g. LEAN) are a big part of this. Since AI needs to run on phones and that needs GPUs, a lot of phones might need replacement in the next few years.

2025 1

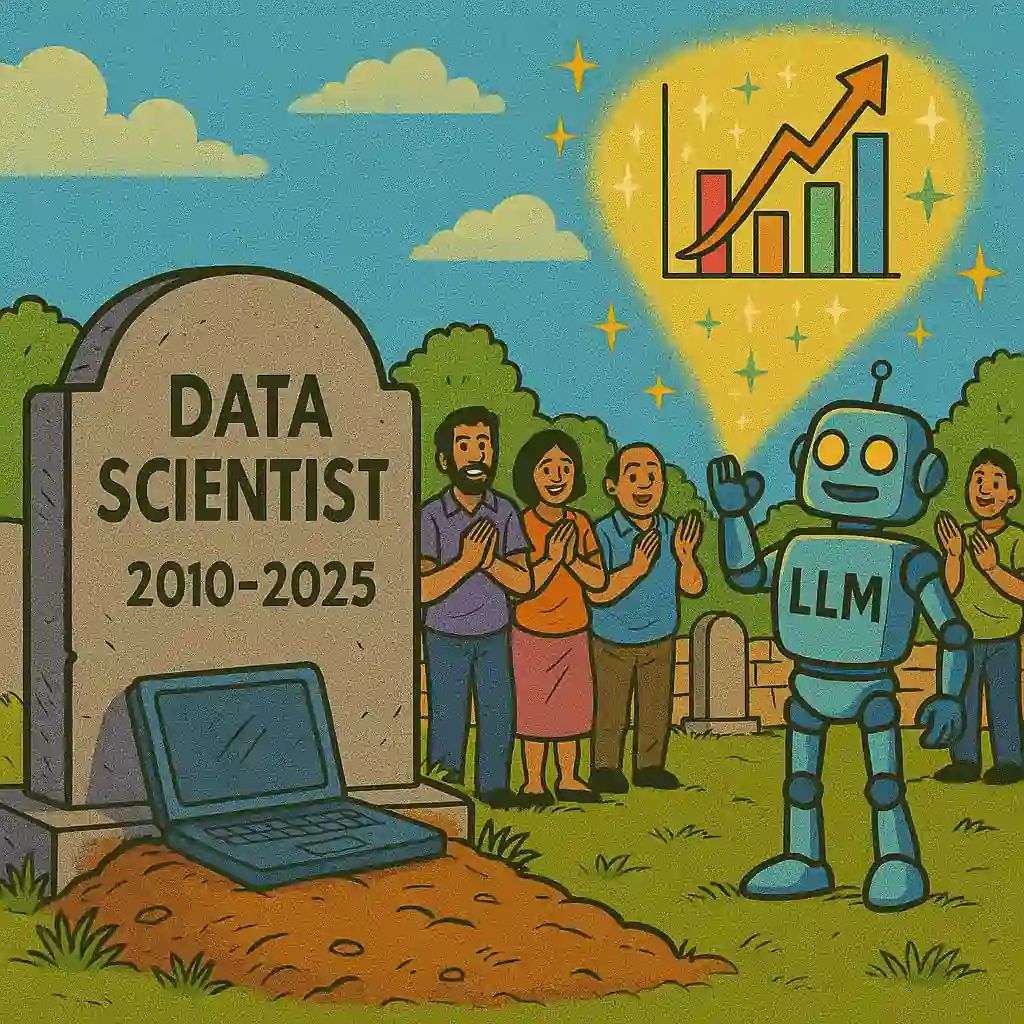
Slides for my DataHack Summit talk (controversially) titled RIP Data Scientists are at https://talks.s-anand.net/2025-08-21-rip-data-scientists/ Summary: as data scientists we explore, clean, model, explain, deploy, and anonymize datasets. I live-vibe-coded each step with DGCA data in 35 minutes using ChatGPT. Of course, it’s the tasks that are dying, not the role. Data scientists will leverage AI, differentiate on other skills, and move on. But the highlight was an audience comment: “I’m no data scientist. I’m a domain person. I’ll tell you all this: If you don’t follow these practices, you won’t have a job with me!” ...

2022 1

I’m planning to publish a 3-hour self-paced #onlinecourse. But I don’t know which topic would be more useful. One topic is #datascience tools for non-programmers. Another is a step-by-step guide to #datastorytelling for analysts. What’s more useful for you? Could you share with people, so I work on the more useful course? (Thanks 🙏) LinkedIn

2019 1

If you’re a seasoned developer that enjoys working with data, have good front-end skills, and are challenged by impossible deadlines, please drop me a note. I’d love to work with you at Gramener Mumbai. LinkedIn

2015 1

Apparently, I’m one of the top 10 data scientists in India. http://analyticsindiamag.com/top-10-data-scientists-in-india-2015/ LinkedIn

2014 1

A-Z of my browsing history

When you start typing in the address bar, Chrome suggests a link to visit, based on frecency. What do my recommendations look like? A is for airtel.in/smartbyte-s/page.html – the page where you can check your bandwidth usage. I used to check it infrequently until I upgraded to a 125GB connection. Now I check it every few days and feel miserable that I’ve nowhere near used up my quota. This has coerced me to watch many Telugu movies, of which I don’t understand a word. B is for blog.gramener.com – I blog there on data stories. The last month or so has been fairly active thanks to the elections. C is for calendar.google.com – which has become primarily a shared calendar. It was always indispensible to manage my time. Now it helps my colleagues pick when to call me. Right now, my calendar has events booked about two months in advance. D is for docs.google.com – for effectively one single purpose: shared spreadsheets. This is such a common and powerful use case, and I’m surprised it hasn’t become much easier to use. E is for epaper.timesofindia.com – some of our content has been published by The Economic Times, and I keep doing ego-searches in the print edition. But close behind is eci.nic.in which I’ve been scraping a lot, and election-results.ibnlive.in.com which we created for CNN-IBN. F is for flipkart.com – not facebook.com. I’m not often on Facebook. G is for gramener.com. Naturally. (It’s not surprising that it’s not google.com: I search directly from the address bar.) H is for handsontable.com – a library that I’ve been using a lot recently, followed by html5please.com that tells me which HTML5 features are ready for use. I is for ibn.gramener.com – another property we created, but it only just beats irctc.co.in. J is for join.me – a clean way to share your screen without the audience having to install anything (though you the sharer do have to install the software.) K is for kraken.io – an amazingly efficient image compressor. As you might have guessed, I lead a strange life. L is for learn.gramener.com – our Intranet. Sorry, you can’t access this one. M is for mail.google.com. I’ll probably be moving away from gmail as a backend this weekend to Mail-in-a-box, though. Google’s pulling the plug on Google Reader has shaken my faith. N is for news.ycombinator.com. When I’m bored and want to watch something while I have dinner, I don’t open YouTube. I open Hacker News. O is for odc.datameet.org – the Open Data Camp. I’m quite into open data. P is for pay.airtel.com, but if you ignore the number of bills I pay, it would be pandas.pydata.org, the home page of a remarkable data processing library. Q is for quirksmode.org, PPK’s remarkable browser-compatibility guide R is for reader.s-anand.net, my self-hosted RSS reader. It used to be reader.google.com, but Google let me down there. S is for s-anand.net – this blog. T is for twitter.com. Unlike Facebook, I don’t dislike Twitter so much. U is for underscorejs.org. Clearly I need to get a life. V is for visualizing.org. They have a number of interesting data visualisations. W is for webpagetest.org – it helps measure the speed of web pages. X is for xem.github.io. I’ve probably visited this page once, but it’s the only one in my recent history that starts with X Y is for youtube.com. I lied. I spend an order of magnitude more time watching Telugu movies on YouTube than on Hacker News. Z is for zoemob.com. Again, a page I visited only once, but there’s nothing else in Z at the moment. Comments Software I currently use | s-anand.net 9 May 2014 6:24 pm (pingback): […] course, some of my apps apps have moved online, and my earlier post on the A-Z of my browsing history covers that. But there are a few applications that I’ve hosted which I must talk about. […] chandigarh 13 Oct 2015 7:27 pm: you can delete your web search history through link https://history.google.com/history

2012 2

The most popular scientific Python modules

I just scraped the scientific packages on pypi. Here are the top 50 by downloads. Name Description Size Downloads numpy NumPy: array processing for numbers, strings, records, and objects. 2000000 133076 scipy SciPy: Scientific Library for Python 7000000 33990 pygraphviz Python interface to Graphviz 99000 22828 geopy Python Geocoding Toolbox 32000 18617 googlemaps Easy geocoding, reverse geocoding, driving directions, and local search in Python via Google. 69000 15135 Rtree R-Tree spatial index for Python GIS 495000 14370 nltk Natural Language Toolkit 1000000 12844 Shapely Geometric objects, predicates, and operations 93000 12635 pyutilib.component.doc Documentation for the PyUtilib Component Architecture. 372000 10181 geojson Encoder/decoder for simple GIS features 12000 9407 GDAL GDAL: Geospatial Data Abstraction Library 410000 8957 scikits.audiolab A python module to make noise from numpy arrays 1000000 8856 pupynere NetCDF file reader and writer. 16000 8809 scikits.statsmodels Statistical computations and models for use with SciPy 3000000 8761 munkres munkres algorithm for the Assignment Problem 42000 8409 scikit-learn A set of python modules for machine learning and data mining 2000000 7735 networkx Python package for creating and manipulating graphs and networks 1009000 7652 pyephem Scientific-grade astronomy routines 927000 7644 PyBrain PyBrain is the swiss army knife for neural networking. 255000 7313 scikits.learn A set of python modules for machine learning and data mining 1000000 7088 obspy.seisan SEISAN read support for ObsPy. 3000000 6990 obspy.wav WAV(audio) read and write support for ObsPy. 241000 6985 obspy.seishub SeisHub database client for ObsPy. 237000 6941 obspy.sh Q and ASC (Seismic Handler) read and write support for ObsPy. 285000 6926 crcmod CRC Generator 128000 6714 obspy.fissures DHI/Fissures request client for ObsPy. 1000000 6339 stsci.distutils distutils/packaging-related utilities used by some of STScI's packages 25000 6215 pyopencl Python wrapper for OpenCL 1000000 6124 Kivy A software library for rapid development of hardware-accelerated multitouch applications. 11000000 5879 speech A clean interface to Windows speech recognition and text-to-speech capabilities. 17000 5809 patsy A Python package for describing statistical models and for building design matrices. 276000 5517 periodictable Extensible periodic table of the elements 775000 5498 pymorphy Morphological analyzer (POS tagger + inflection engine) for Russian and English (+perhaps German) languages. 70000 5174 imposm.parser Fast and easy OpenStreetMap XML/PBF parser. 31000 4940 hcluster A hierarchical clustering package for Scipy. 442000 4761 obspy.core ObsPy - a Python framework for seismological observatories. 487000 4608 Pyevolve A complete python genetic algorithm framework 99000 4509 scikits.ann Approximate Nearest Neighbor library wrapper for Numpy 82000 4368 obspy.imaging Plotting routines for ObsPy. 324000 4356 obspy.xseed Dataless SEED, RESP and XML-SEED read and write support for ObsPy. 2000000 4331 obspy.sac SAC read and write support for ObsPy. 306000 4319 obspy.arclink ArcLink/WebDC client for ObsPy. 247000 4164 obspy.iris IRIS Web service client for ObsPy. 261000 4153 Orange Machine learning and interactive data mining toolbox. 14000000 4099 obspy.neries NERIES Web service client for ObsPy. 239000 4066 pandas Powerful data structures for data analysis, time series,and statistics 2000000 4037 pycuda Python wrapper for Nvidia CUDA 1000000 4030 GeoAlchemy Using SQLAlchemy with Spatial Databases 159000 3881 pyfits Reads FITS images and tables into numpy arrays and manipulates FITS headers 748000 3746 HTSeq A framework to process and analyze data from high-throughput sequencing (HTS) assays 523000 3720 pyopencv PyOpenCV - A Python wrapper for OpenCV 2.x using Boost.Python and NumPy 354000 3660 thredds THREDDS catalog generator. 25000 3622 hachoir-subfile Find subfile in any binary stream 16000 3540 fluid Procedures to study geophysical fluids on Python. 210000 3520 pygeocoder Python interface for Google Geocoding API V3. Can be used to easily geocode, reverse geocode, validate and format addresses. 7000 3514 csc-pysparse A fast sparse matrix library for Python (Commonsense Computing version) 111000 3455 topex A very simple library to interpret and load TOPEX/JASON altimetry data 7000 3378 arrayterator Buffered iterator for big arrays. 7000 3320 python-igraph High performance graph data structures and algorithms 3000000 3260 csvkit A library of utilities for working with CSV, the king of tabular file formats. 29000 3236 PyVISA Python VISA bindings for GPIB, RS232, and USB instruments 237000 3201 Quadtree Quadtree spatial index for Python GIS 40000 3000 ProxyHTTPServer ProxyHTTPServer -- from the creator of PyWebRun 3000 2991 mpmath Python library for arbitrary-precision floating-point arithmetic 1000000 2901 bigfloat Arbitrary precision correctly-rounded floating point arithmetic, via MPFR. 126000 2879 SimPy Event discrete, process based simulation for Python. 5000000 2871 Delny Delaunay triangulation 18000 2790 pymc Markov Chain Monte Carlo sampling toolkit. 1000000 2727 PyBUFR Pure Python library to encode and decode BUFR. 10000 2676 collective.geo.bundle Plone Maps (collective.geo) 11000 2676 dap DAP (Data Access Protocol) client and server for Python. 125000 2598 rq RQ is a simple, lightweight, library for creating background jobs, and processing them. 29000 2590 pyinterval Interval arithmetic in Python 397000 2558 StarCluster StarCluster is a utility for creating and managing computing clusters hosted on Amazon's Elastic Compute Cloud (EC2). 2000000 2521 fisher Fast Fisher's Exact Test 43000 2503 mathdom MathDOM - Content MathML in Python 169000 2482 img2txt superseded by asciiporn, http://pypi.python.org/pypi/asciiporn 443000 2436 DendroPy A Python library for phylogenetics and phylogenetic computing: reading, writing, simulation, processing and manipulation of phylogenetic trees (phylogenies) and characters. 6000000 2349 geolocator geolocator library: locate places and calculate distances between them 26000 2342 MyProxyClient MyProxy Client 67000 2325 PyUblas Seamless Numpy-UBlas interoperability 51000 2252 oroboros Astrology software 1000000 2228 textmining Python Text Mining Utilities 1000000 2198 scikits.talkbox Talkbox, a set of python modules for speech/signal processing 147000 2188 asciitable Extensible ASCII table reader and writer 312000 2160 scikits.samplerate A python module for high quality audio resampling 368000 2151 tabular Tabular data container and associated convenience routines in Python 52000 2114 pywcs Python wrappers to WCSLIB 2000000 2081 DeliciousAPI Unofficial Python API for retrieving data from Delicious.com 19000 2038 hachoir-regex Manipulation of regular expressions (regex) 31000 2031 Kamaelia Kamaelia - Multimedia & Server Development Kit 2000000 2007 seawater Seawater Libray for Python 2000000 1985 descartes Use geometric objects as matplotlib paths and patches 3000 1983 vectorformats geographic data serialization/deserialization library 10000 1949 PyMT A framework for making accelerated multitouch UI 18000000 1945 times Times is a small, minimalistic, Python library for dealing with time conversions between universal time and arbitrary timezones. 4000 1929 CocoPy Python implementation of the famous CoCo/R LL(k) compiler generator. 302000 1913 django-shapes Upload and export shapefiles using GeoDjango. 9000 1901 sympy Computer algebra system (CAS) in Python 5000000 1842 pyfasta fast, memory-efficient, pythonic (and command-line) access to fasta sequence files 14000 1836 Comments Ron Z 25 Jun 2013 10:19 pm: Another good one is simpleCV: http://www.simplecv.org/ Ravindranath M 8 Apr 2013 7:13 am: Nice list Anand. Very useful. – This is Ravi from Comviva, who attended your introduction.

The next chapter of my life

I’m writing this post on a one-way flight from London back to India. I’ve moved on from Infosys Consulting, and am starting up on my own. I’ve wanted to do this for a long time. There’s always more freedom in your own company than someone else’s. There’s often more money in it too, if you’re lucky enough. But my upbringing is a bit too conservative to make that bold step. However, given that my father runs his own firm, I figured it was just a question of time for me to do the same. ...

2010 1

Bayes’ Theorem

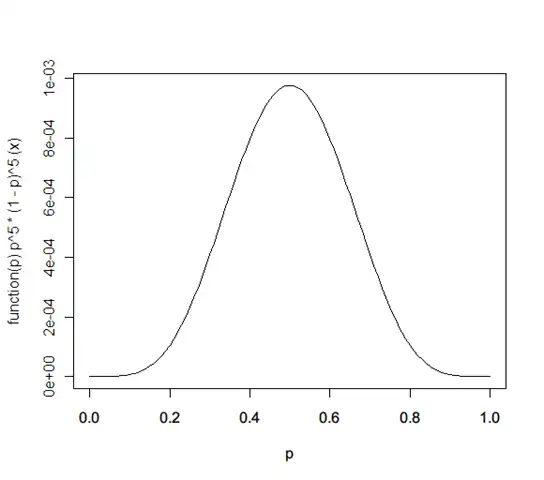
I’ve tried understanding Bayes’ Theorem several times. I’ve always managed to get confused. Specifically, I’ve always wondered why it’s better than simply using the average estimate from the past. So here’s a little attempt to jog my memory the next time I forget. Q: A coin shows 5 heads when tossed 10 times. What’s the probability of a heads? A: It’s not 0.5. That’s the most likely estimate. The probability distribution is actually: ...

2009 1

About me

You may know me as S Anand. You may also know me as Prof or Stud at the Indian Institute of Management, Bangalore, as Anand Subramanian at IBM India, Bhalla at Alakananda hostel, IIT Madras, and Bal at Vidya Mandir. LinkedIn CV (2026) - PDF History 1974-1978 at home I was born on the 23rd November, 1974 (a Saturday) at Tirupati. I flew back to Madras (now Chennai) in a few days along with my parents. I stayed at home for 4 years, thoroughly enjoying myself. My mother would feed me while telling me stories while I was perched on her hip looking at the cows behind our house (it was no mean feat — I think I weighed 20 kilos). Since I was the youngest grandchild in our family, no one was permitted to get angry with me — especially if I sat on them and hit them with whatever they wouldn’t give me. ...

2007 1

Managing the data deluge

Peter Norvig’s brilliant talk on Managing the Data Deluge. Among other things, he talks about how having lots of data is sometimes better than having a carefully designed algorithm.

2006 1

Math will rock your world

It’s a good time to be a mathematician.