2006 1

In-cell Excel charts

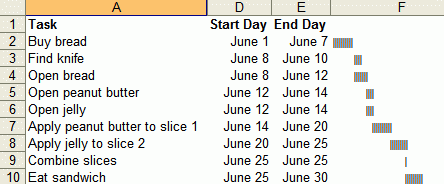
Juice analytics has some Excel graphing tips. You can make charts like below without using charts, using just text. These are useful because the charts are aligned with the data. I once used a similar technique to display people’s staffing position. The sheet below lists people, projects they’re on and how long they’ll be on. The coloured cells to the right are a calendar display of the same stuff. Makes it easy to read. ...

2005 2

Excel - Avoid manual labour 4

Debugging in Excel is another time consuming task. 80% of the trouble is identifying the problem (Error? What error? Where?) as opposed to fixing it (Why’s THAT cell showing THAT?). Most of my time is spent chasing three kinds of errors: wrong reference (leading to a #N/A or #REF!), wrong data input, or wrong formula. Wrong references are easy to spot. You’ll see a #N/A or a #REF! sticking out. But on large sheets, even that’s tough to spot. I always have a SUM (or some kind of total) function that covers EVERY cell in EVERY table, even if I don’t need that information. If ther SUM shows a #N/A or #REF!, I can use Trace Error (Alt-T-U-E) to see where the problem is coming from. ...

Excel - Avoid manual labour

Rule #3: Avoid manual labour. Use Excel to automate the task. I use Excel’s formulas to speed up repetitous tasks. These techniques are powerful, meaning, you can do a lot with a little, but can have unforeseen consequences. Excel can find and replace formulas. If you had hardcoded formulas and wanted to change =B1*3.14 to =B1*3.1416 across all rows, just find “*3.14” and replace it with “*3.1416”. Find and replace works in formulas. This is very powerful. You can use it to change the source (e.g. change the source from column B to C by finding “=B” and replacing with “=C”) or even the formula (find and replace “SUM(” with “SUBTOTAL(9,”). ...