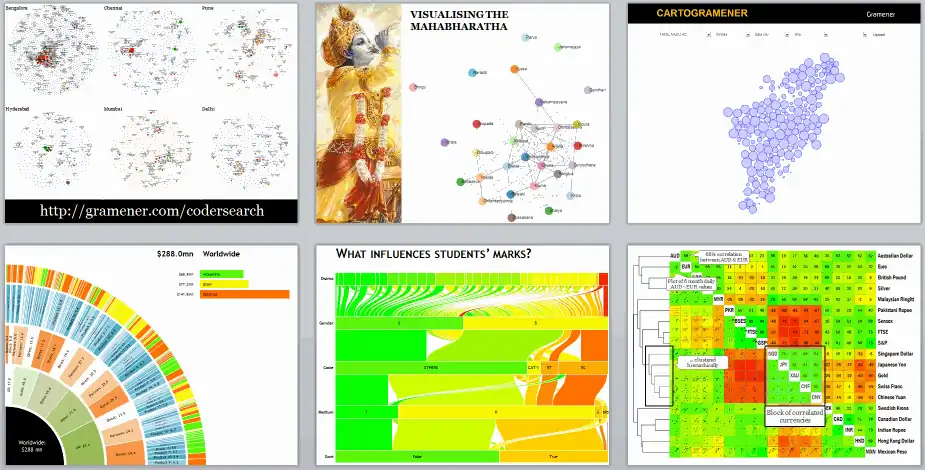
I shared slides from my series of talks on network visualization and relational data. These materials, including my presentation at The Fifth Elephant, explore the technical and aesthetic challenges of mapping complex connections and visual structures.
Some slides from my talks on visualising networks. (These are part of a series of talks I’m giving at a number of forums; the one at The Fifth Elephant is open to public.)
I recommend this technical overview of complex networks literature, especially the section on network properties. It offers a grounded perspective on the limited current understanding of real-world network structures and their underlying statistical characteristics.
I built a heatmap mapping IMDb ratings against vote counts to find movies I've missed. It helps me visualize popular high-rated outliers, track my viewing progress, and filter by genre to discover hidden gems outside the Top 250.
I found a guide on hacking wireless networks that explains how to gain access to secure connections and monitor user activity. It covers basic penetration techniques and network surveillance for security enthusiasts.
I examine how scale-free networks evolve naturally to include central hubs, providing robustness against random failures but creating targeted vulnerabilities. These articles from the Santa Fe Institute detail how evolution differs from intentional design.
I revised my student performance visualizations using Python and SVG to improve readability for teachers. These color-coded dashboards use grade distributions and trend graphs to identify bimodal distributions, top performers, and individual subject struggles at a glance.