2025 1

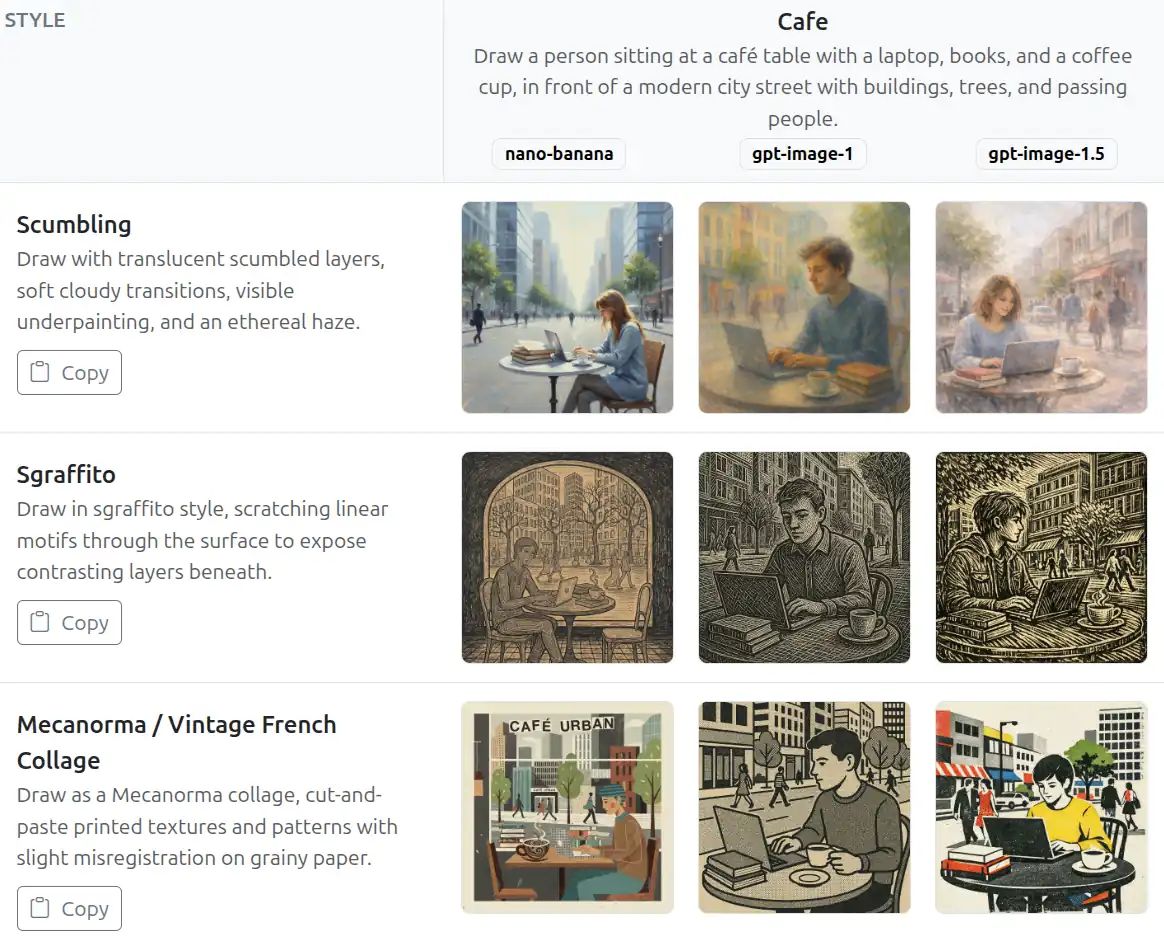
I tried out GPT Image 1.5. It adds more contrast, ink, texture, detail, and polish. See https://sanand0.github.io/llmartstyle/?category=pop It’s more powerful when generating different infographic styles: https://sanand0.github.io/llmartstyle/?category=text But it’s still terrible at faces. Overall, better competition for Nano Banana. Not yet dethroning Nano Banana Pro for me. LinkedIn

2021 1

I’m running a #webinar for #developers & #designers on Thu 17 Jun. It’s on creating data-driven infographics – without much code. This is based on new open-source #webcomponents Gramener is releasing - which makes it easy to map SVG attributes to data. It’ll be a light, fun workshop where YOU will build something. You can register at https://info.gramener.com/creating-data-driven-infographics-with-web-components Note: Webinar recording it at https://youtu.be/Np50SvvX8UY LinkedIn

2007 1

Periodic table of visualization methods

Periodic table of visualization methods. 100 visualizations (graphs, diagrams, etc.) organised into 6 groups (data, information, concept, strategy, metaphor, compound), and arranged exactly like the periodic table. (This, in itself, is a lovely visualization.) It includes diverse visuals from the Metro Map (e.g. London Underground Map) and cartoons to scatterplots and treemaps. Just browse it. It’s wonderful. Comments Rajlaxmi 16 Feb 2007 6:37 pm: gr8 link n well explained. wonder how u get these links

2001 1

Time photo essay

Time magazine’s photo essay on the tragedy. And then there’s some infographics on the two towers.