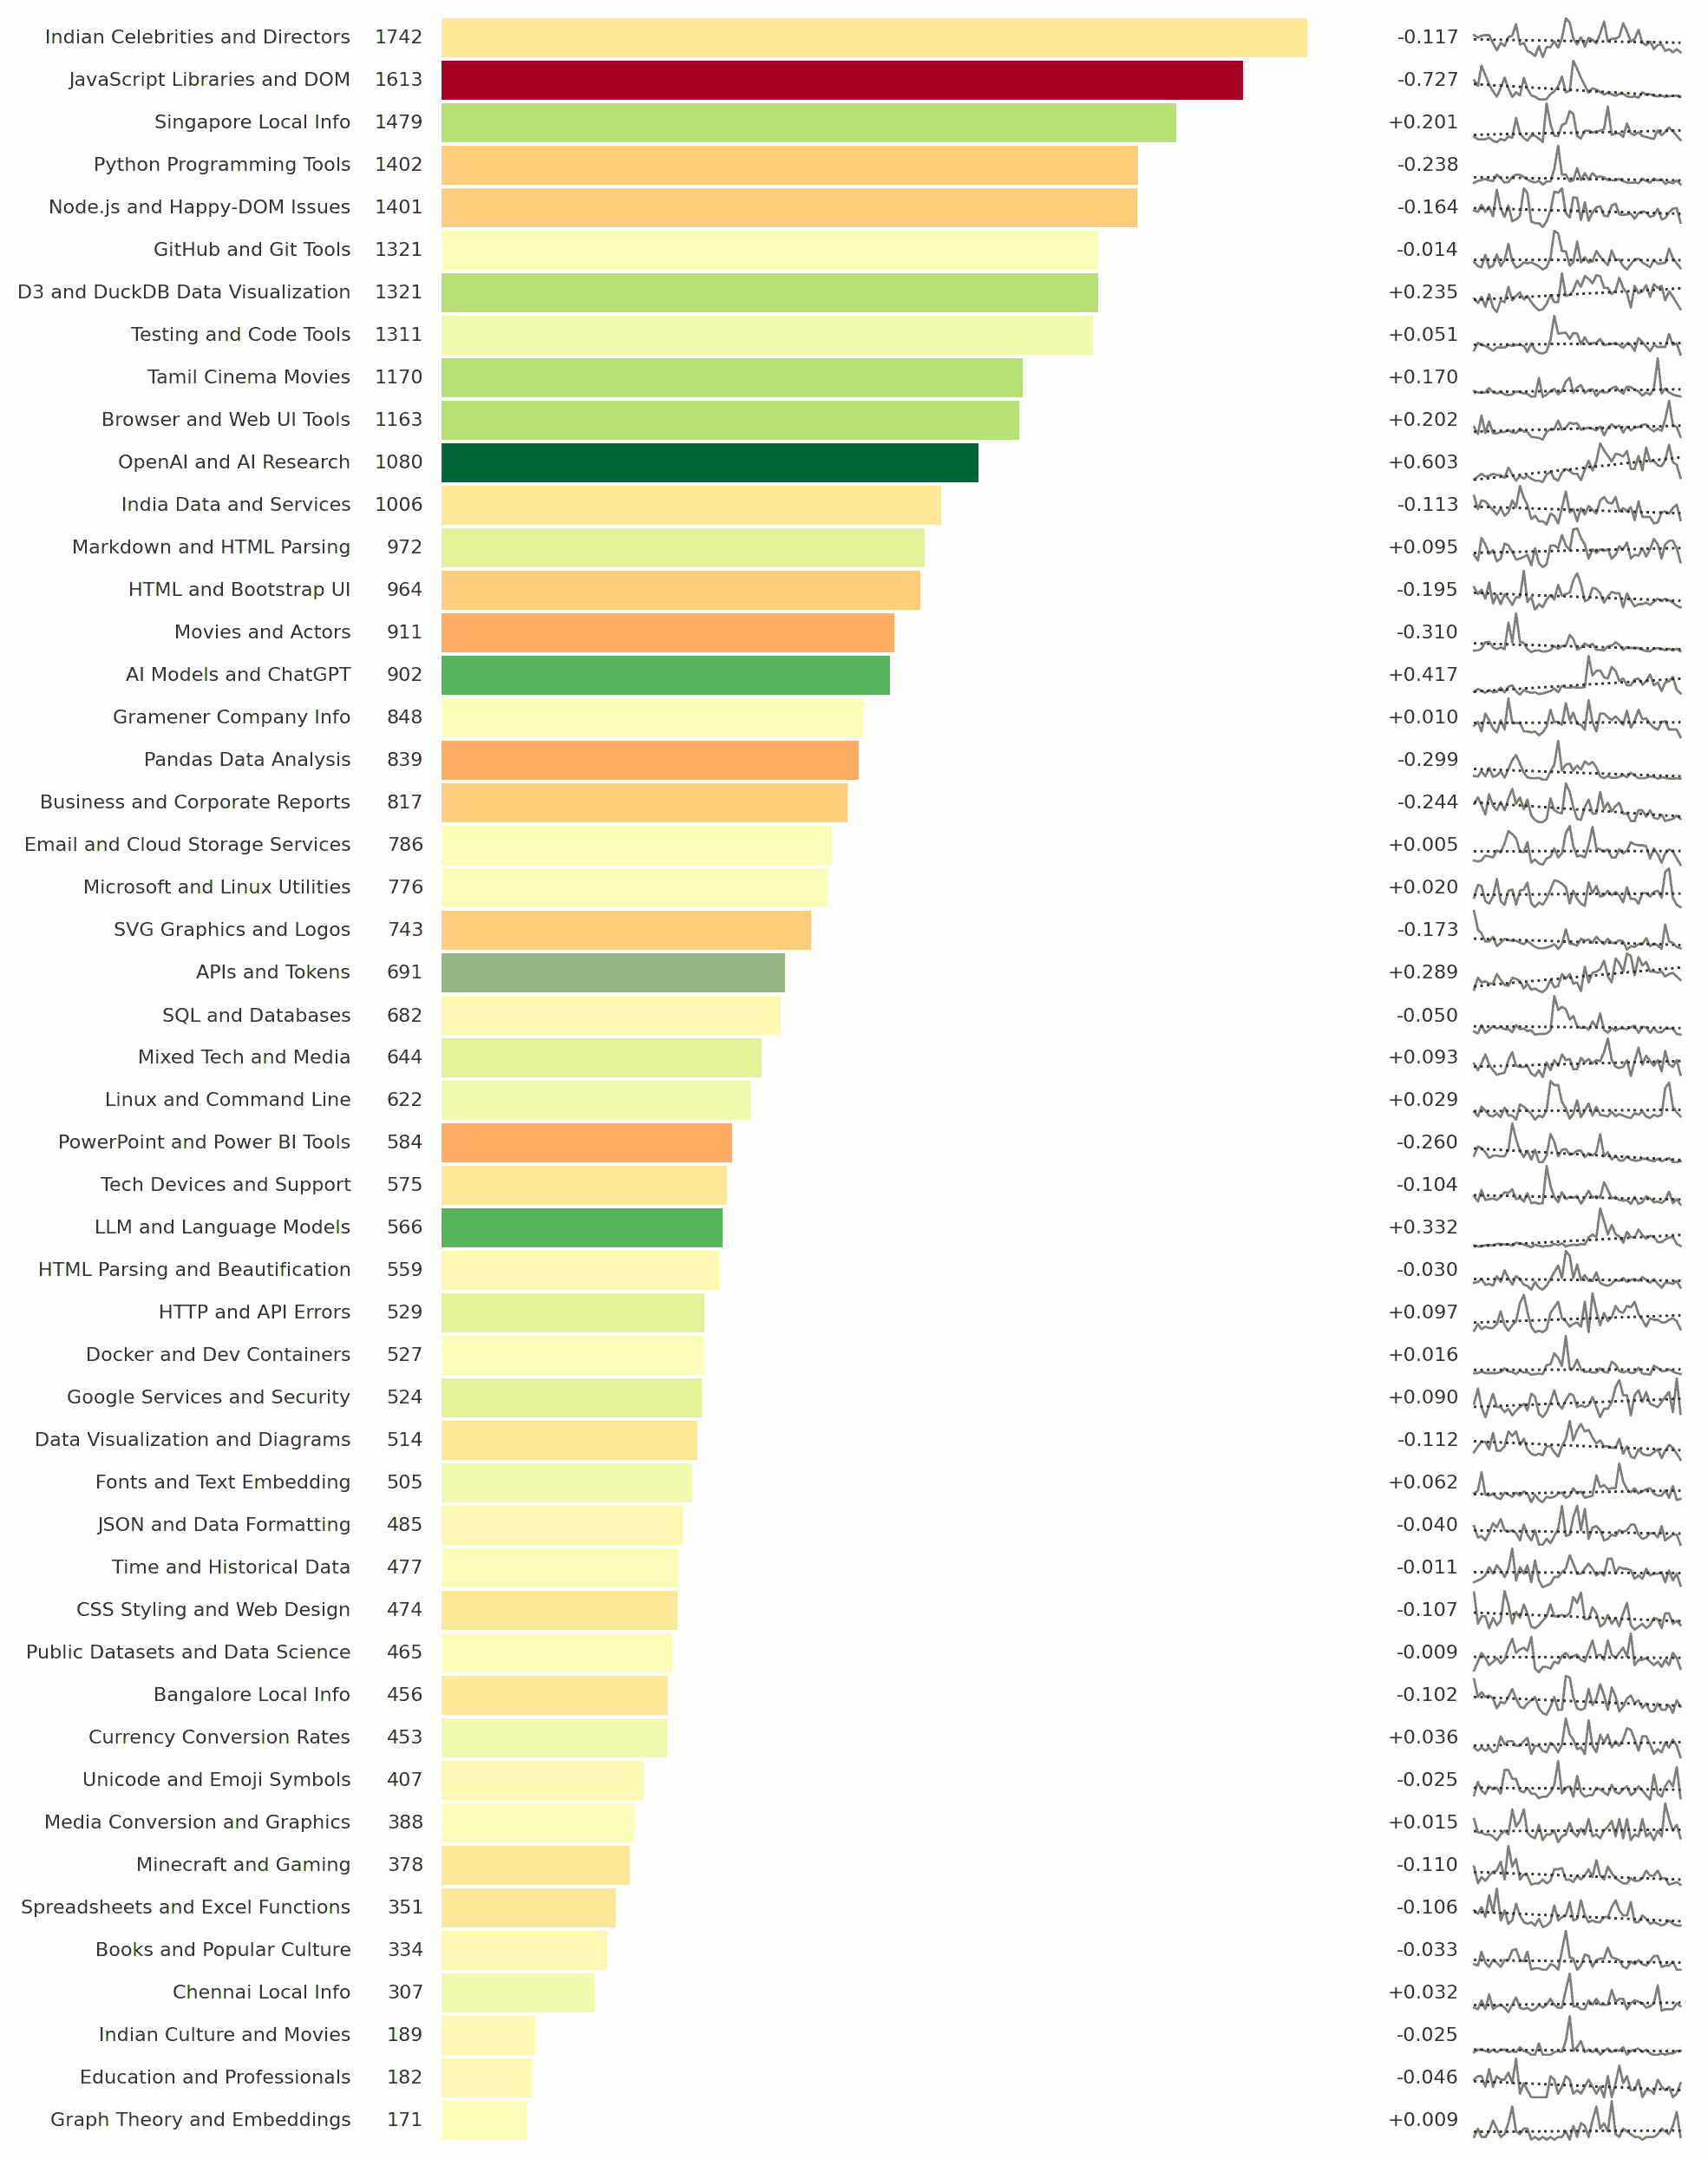
Indian Celebrities and Directors was my top searched category on Google while OpenAI & AI Research was the top growing category.
This is based on my 37,600 searches on Google since Jan 2021. Full analysis: https://sanand0.github.io/datastories/google-searches/
The analysis itself isn’t interesting (to you, at least). Rather, it’s the two tools that enabled it.
First, topic modeling. If you have all your searches exported (via Google Takeout) into a text file, you can run:
uvx topicmodel searches.txt --ntopics 50
… and automatically get the top 50 topics you search for.
Second, an improved O3 prompt. I fed it monthly topics volume and asked:
Look closely at the numbers as well as the image. What insights can you draw from these? Aim for non-obvious non-trivial insights. Run correlations or any other analyses on the data to go deeper and come up with material suitable for a deep research paper.
The analyses it did was far more powerful than anything I would have thought of.
- It calculated my Herfindahl-Hirschman index slope and declared that my search interests are diversifying. (Good to know!)
- Using Principal Component Analysis it discovered 3 personas in my searches
- Classical developer (Python, JS)
- AI-builder (OpenAI, LLMs, APIs)
- India/Singapore geo-culturist (Celebs, local info, Tamil cinema) I should segment sharing & learning along these axes (e.g. separate newsletters or dashboards.)
- Using the Coefficient of Variation it found the biggest spikes in SQL & Databases, and Testing & Code Tools. Steadiest were Currency Conversion Rates and Singapore/Bangalore Local Info.
I should cache common reference lookups locally and allocate “deep‑focus blocks” for debugging spikes.
There’s more. But this is the first time I felt completely outmatched by an LLM. I’m an expert on analysis. I’m an expert on this domain (my search queries.) Yet, this is far more insightful than I ever would have analyzed!