Problems that only one student can solve
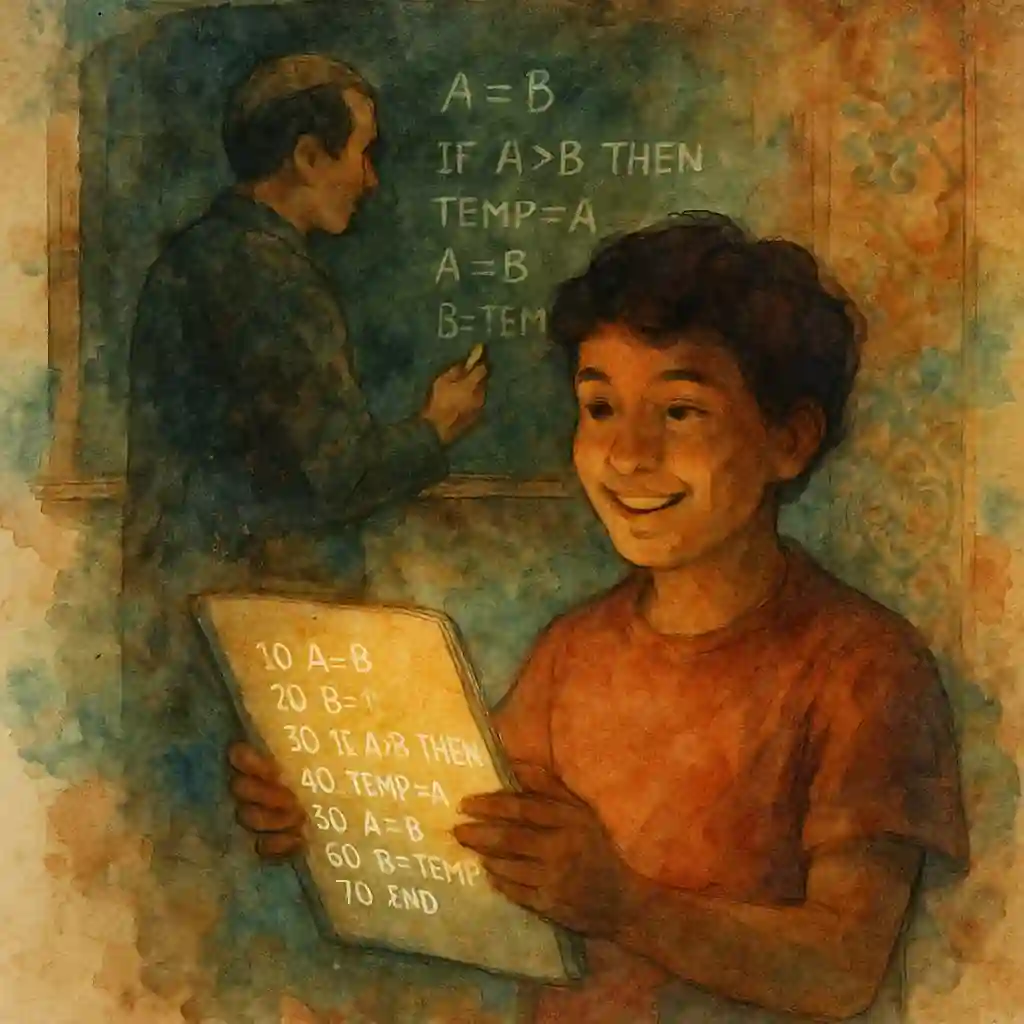
Jaidev’s The Bridge of Asses reminded me of my first coding bridge. It was 1986. I’d completed class 6 and was in a summer coding camp at school. M Kothandaraman (“MK Sir”) was teaching us how to swap variables in BASIC on the BBC Micro. This code prints the first name in alphabetical order (“Alice”): 10 A = "Bob" 20 B = "Alice" 30 IF A > B THEN 40 TEMP = A 50 A = B 60 B = TEMP 70 END 80 PRINT A The homework was to print all details of the first alphabetical name: ...