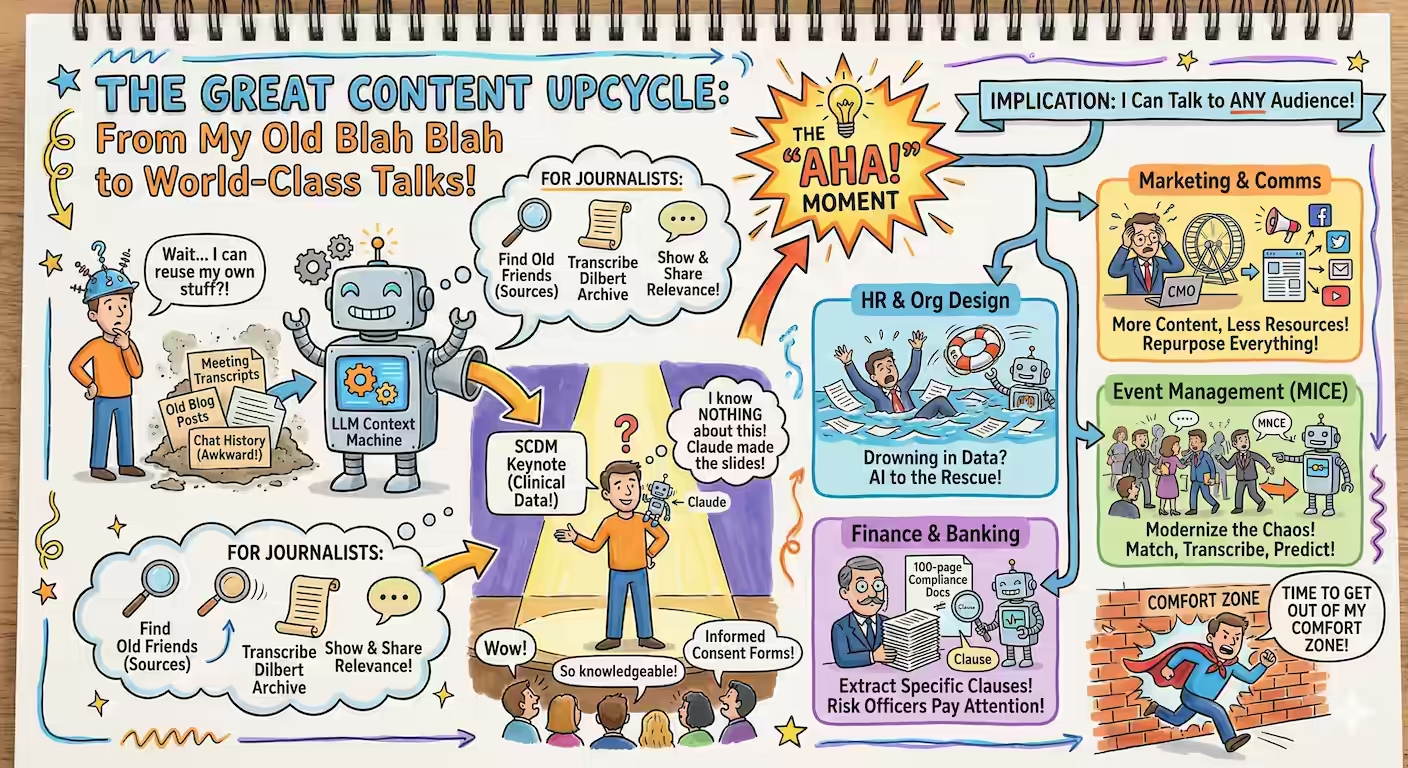
Repurposing blog posts for talks
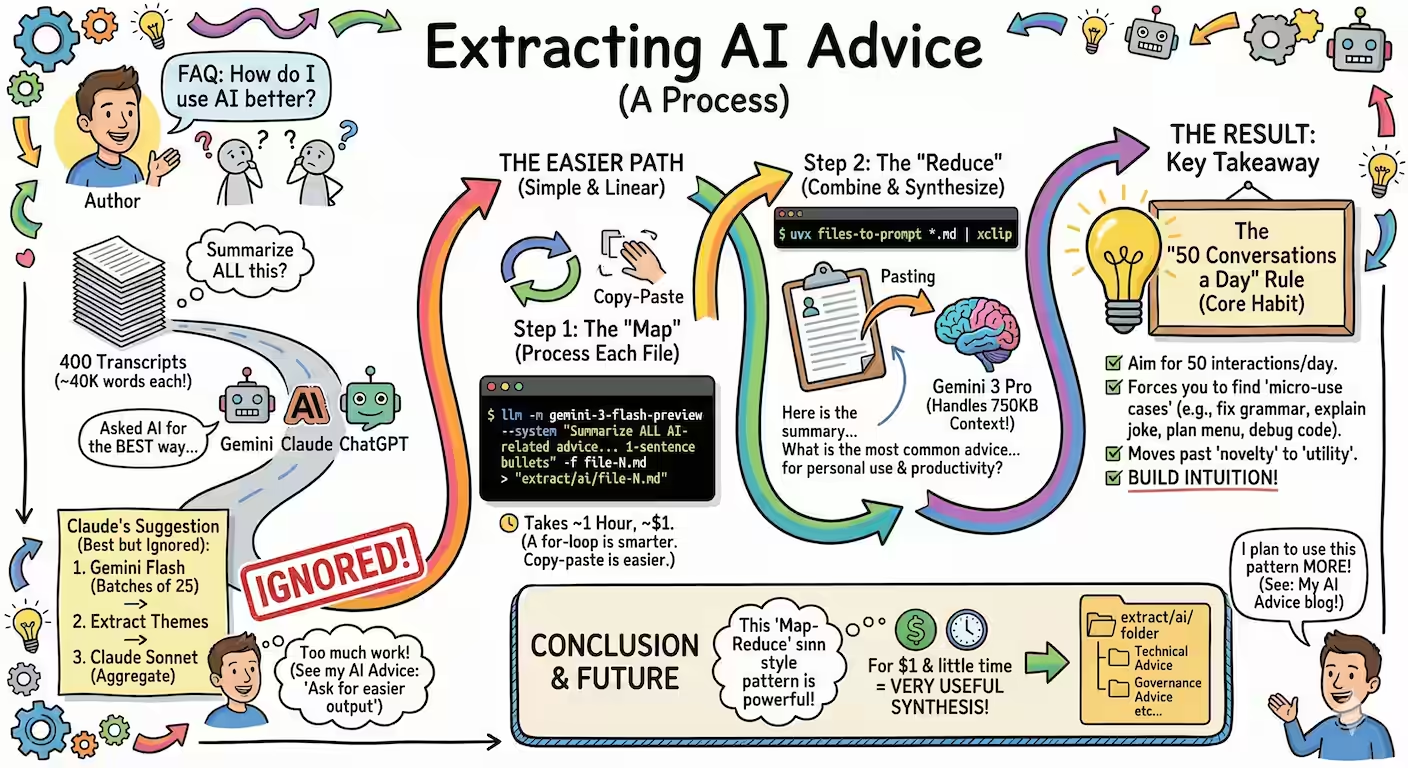
Recently, I’ve re-used my own writing / transcripts as context to LLMs. For example, I’ve used: My meeting transcripts to answer interview questions My blog posts to write news articles My chat history to extract AI-related advice This repurposing can be used for so many things. For example, before delivering a talk to journalists “Review my Feb 2026 LLM posts and generate a single-sentence, ELI15 high-impact use case for journalists.” gets me list of use cases. Now, all I have to do is show what I did and share how it’s relevant for them, like: ...