The most under-rated #geospatial capability is spatial joins, IMHO. It lets you draw correlations from #geodata. During the 2019 assembly elections in India, it allowed me to join voter data (by constituency) with religious population (by district) and show that BJP’s vote share increased with Muslim population, while it reduced the AIMIM-allied JD(S) vote share. That’s just the start. We can explore: Where to open new schools? Where to locate bank branches? Does wealth lead to more or less theft? Does poor health lead to more or less pharmacies? … and hundreds of other random questions. My day job doesn’t let me explore these much. I’d love to work with someone, though. ...
August 15, 2021
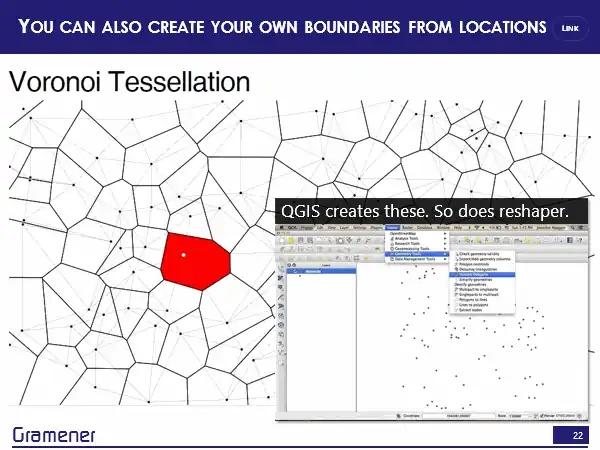
Maps, Delimitation, and Gerrymandering
I delivered a talk at PyCon India 2019. My slides are on Github. This is a transcript of that talk. What I’m going to be talking about is how you can get insights by joining two maps but before we go there, just some basic bookkeeping things. In case you’re tweeting, these are the hashtags, you probably want to be using the #PyconIndia, my hashtag my IDs, #SANAND0, you don’t need to worry about the slides, they are online. I’ve already posted on Twitter, the link to the slide deck, the slide deck that you’re using but if you desperately do want to take notes, then one small suggestion. Research has shown that taking notes on pen and paper is much better than taking notes on laptops if you want to remember stuff or on mobile phones. So this was a discovery for me. In fact, it was my discovery of the year and I’m following it diligently. Do give it a shot if you want to take notes. Let’s dive in. ...