I have managed to fill hard disks of all capacities within a few months. My first PC had 10MB of disk space, while I work on 140GB today (remember: that’s 14 thousand times more capacity in 14 years). Both were filled within 2 months. (An aside: the number of files / folders hasn’t growth by 14,000. The files themselves have grown in size. I have roughly the same number of files/folders today on my machine as I had 14 years ago.)
To regain space, I used to go through every file and delete the unnecessary ones. My favourite tool was the UNIX utility du (Disk Usage). It lists the disk space used by every subdirectory. I would sort the result and find big, useless stuff. Here are the first few lines of a sorted du output:
| 1342507 | ./Books |
| 1188020 | ./Non-Fiction |
| 1047607 | ./Comics |
| 842832 | ./Non-Fiction.Magazines |
| 594939 | ./Audio |
| 298737 | ./Books/kokona – Business |
| 172166 | ./Books/Terry Pratchett |
| 164246 | ./Books/Terry Pratchett/Discworld |
| 162287 | ./Calvin |
| 142274 | ./Books/S |
| 77407 | ./Scripts |
| 74858 | ./Science |
It would take 5 minutes to create the list, and 15 minutes to read.
Nowadays I use WinDirStat, which shows every file and folder in an intuitive, graphical manner.
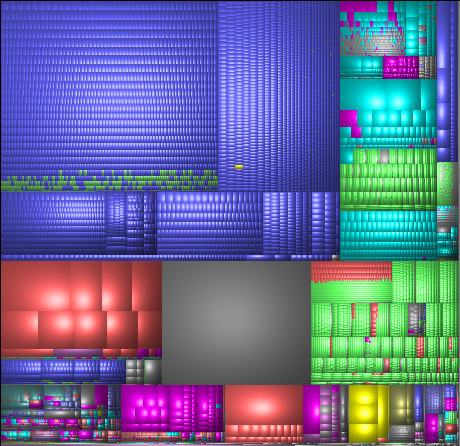
This view is called a Treemap. Each small block is a file. Bigger blocks are folders. Colours indicate the type of file (MP3s are blue, AVIs are red, WMVs are yellow, JPGs are green, etc.). This view has many advantages:
- I can see the relative sizes of files and folders.
- I can get an idea of the % of free space (grey block).
- I can see what type of files occupy the most space.
- etc. etc.
But the most important thing is, I see the useful stuff at a single glance.
That’s the key in visualisation: conveying a complex topic so people get it in a second.
(Incidentally, Google has a TechTalk on visualisation, including treemaps.)