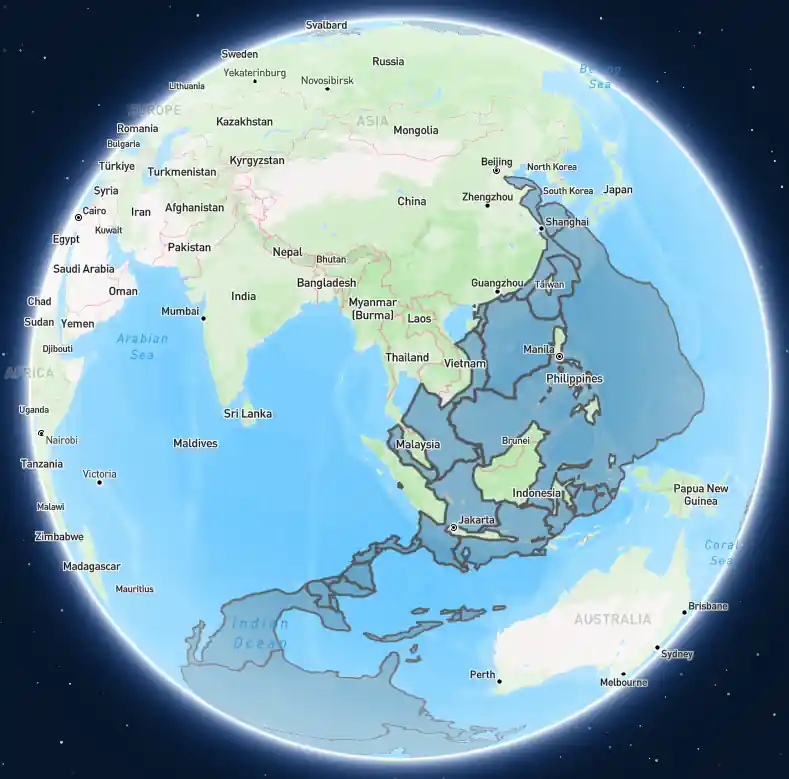
After seeing David McCandless‘ post “Which country is across the ocean?” I was curious which country you would reach if you tunneled below in a straight line (the antipode).
This is a popular visualization, but I wanted to see if I could get the newer OpenAI models to create the visual without me 𝗿𝘂𝗻𝗻𝗶𝗻𝗴 any code (i.e. I just want the answer.) After a couple of iterations, O3 did a great job with this prompt:
𝙱𝚞𝚒𝚕𝚍 𝚊 _𝚜𝚒𝚗𝚐𝚕𝚎_ 𝙶𝚎𝚘𝙹𝚂𝙾𝙽 (𝙴𝙿𝚂𝙶:𝟺𝟹𝟸𝟼) 𝚝𝚑𝚊𝚝 𝚜𝚑𝚘𝚠𝚜, 𝚏𝚘𝚛 𝚎𝚊𝚌𝚑 𝚌𝚘𝚞𝚗𝚝𝚛𝚢, 𝚘𝚗𝚕𝚢 𝚝𝚑𝚎 𝚙𝚊𝚛𝚝𝚜 𝚘𝚏 𝚒𝚝𝚜 𝚊𝚗𝚝𝚒𝚙𝚘𝚍𝚎 𝚝𝚑𝚊𝚝 𝚕𝚒𝚎 𝚘𝚟𝚎𝚛 𝚘𝚌𝚎𝚊𝚗. 𝙲𝚊𝚛𝚎𝚏𝚞𝚕𝚕𝚢 𝚑𝚊𝚗𝚍𝚕𝚎 𝚌𝚘𝚞𝚗𝚝𝚛𝚒𝚎𝚜 𝚝𝚑𝚊𝚝 𝚜𝚝𝚛𝚊𝚍𝚍𝚕𝚎 𝚝𝚑𝚎 𝚙𝚛𝚒𝚖𝚎 𝚖𝚎𝚛𝚒𝚍𝚒𝚊𝚗 - 𝚄𝙺, 𝙵𝚛𝚊𝚗𝚌𝚎, 𝙰𝚕𝚐𝚎𝚛𝚒𝚊, 𝚎𝚝𝚌.Here is the output and here is the ChatGPT conversation that generated it.
I learnt a few things:
- Ask for the output, not the code. Models like O3 and O4 Mini can run code while thinking. Let’s stop asking for code to run. Just ask for the output directly. Let it figure out how.
- Edge cases are everywhere. I had a problem with UK, France, Algeria, etc. straddling the prime meridian. If all goes well, you get AI-speed results. But it never does, and fixing it takes an expert and human-speed results. Programmers under-estimate edge cases, so compensate for this.
If you want to run this yourself, the code is at https://github.com/sanand0/antipodes