Visualisation

Visualisation – centralisation smoothens demand

Often, presentations and documents make complex points. It’s useful to convey these as a simple visual. It’s worthwhile to make the effort and do a simple visual for every slide or paragraph.

Once, a retail bank asked us if they should centralise their operations. They had operations distributed across branches, regional hubs, and a central hub. After 2 months of work, this was our story:

  1. Centralising smoothens demand
  2. Centralising improves productivity
  3. Your activities are decentralised (so you should consolidate)
  4. To do that effectively, you need a few more regional hubs

Centralising smoothens demand

The mathematics is simple. If you have operations in two hubs, A and B, the variance (in demand) for A and B, individually, will exceed the variance for a combined hub A+B. Therefore, you’ll have a smoother demand for the combined hub.

Var(A) + Var(B) >= Var(A+B)

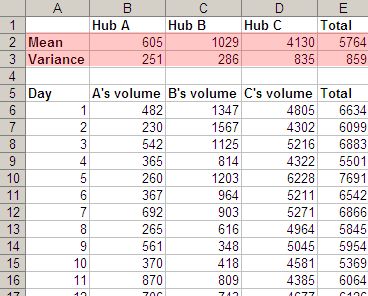
But we couldn’t just say that in a slide. So we collected data about the daily volumes at three hubs, and it clearly showed the result. Var(A) + Var(B) + Var(C) > Var(A+B+C).

Centralised Hub reduces total variance

But it’s tough to get the message instantly from this. The main problem is, it’s not obvious how variance (a mathematical concept) relates to smoothening demand. So we showed a graph of the load, with individual hubs on the left and the combined hub on the right.

Graphical view of how centralisation reduces variance

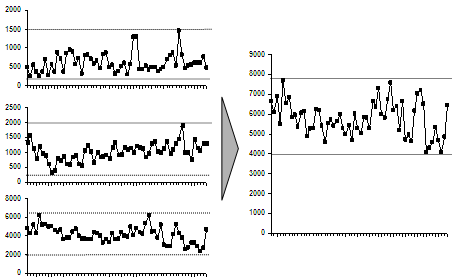
It’s very easy to see this from the graph: demand at the individual hubs varies more than at the combined hub. People would take one look at it and go, “Oh, yeah… I get it. Move on.” (Incidentally, that’s the best possible outcome for a slide. People glance at it, say “Oh yeah, that’s clear. Move on.” It’s what we dream of.)

Visualisation – centralisation smoothens demand Read More »

Visualisation of data

I have managed to fill hard disks of all capacities within a few months. My first PC had 10MB of disk space, while I work on 140GB today (remember: that’s 14 thousand times more capacity in 14 years). Both were filled within 2 months. (An aside: the number of files / folders hasn’t growth by 14,000. The files themselves have grown in size. I have roughly the same number of files/folders today on my machine as I had 14 years ago.)

To regain space, I used to go through every file and delete the unnecessary ones. My favourite tool was the UNIX utility du (Disk Usage). It lists the disk space used by every subdirectory. I would sort the result and find big, useless stuff. Here are the first few lines of a sorted du output:

1342507 ./Books
1188020 ./Non-Fiction
1047607 ./Comics
842832 ./Non-Fiction.Magazines
594939 ./Audio
298737 ./Books/kokona – Business
172166 ./Books/Terry Pratchett
164246 ./Books/Terry Pratchett/Discworld
162287 ./Calvin
142274 ./Books/S
77407 ./Scripts
74858 ./Science

It would take 5 minutes to create the list, and 15 minutes to read.

Nowadays I use WinDirStat, which shows every file and folder in an intuitive, graphical manner.

Treemap from WinDirStat

This view is called a Treemap. Each small block is a file. Bigger blocks are folders. Colours indicate the type of file (MP3s are blue, AVIs are red, WMVs are yellow, JPGs are green, etc.). This view has many advantages:

  • I can see the relative sizes of files and folders.
  • I can get an idea of the % of free space (grey block).
  • I can see what type of files occupy the most space.
  • etc. etc.

But the most important thing is, I see the useful stuff at a single glance.

That’s the key in visualisation: conveying a complex topic so people get it in a second.

(Incidentally, Google has a TechTalk on visualisation, including treemaps.)

Visualisation of data Read More »