Bayes’ Theorem
I’ve tried understanding Bayes’ Theorem several times. I’ve always managed to get confused. Specifically, I’ve always wondered why it’s better than simply using the average estimate from the past. So here’s a little attempt to jog my memory the next time I forget.
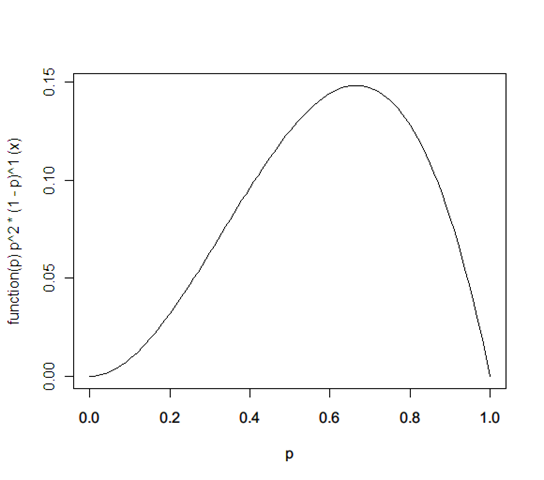
Q: A coin shows 5 heads when tossed 10 times. What’s the probability of a heads?
A: It’s not 0.5. That’s the most likely estimate. The probability distribution is actually:
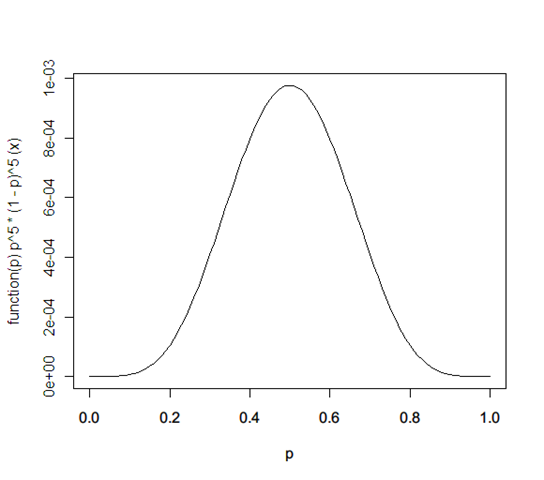
That’s because you don’t really know the probability with which the coin will throw a heads. It could be any number p. So lets say we have a probability distribution for it, f(p).
Initially, you don’t know what this probability distribution is. So assume they’re all the same – a flat function: f(p) = 1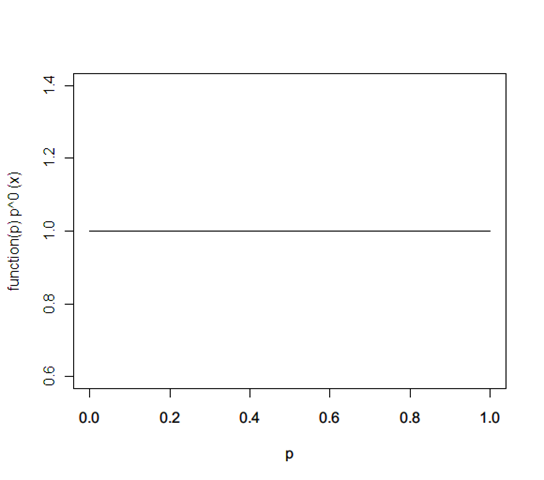
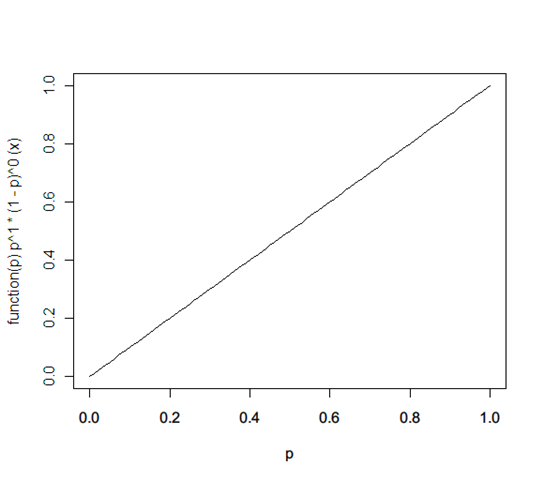
Now, given this, let’s say a heads falls on the next toss. What’s the revised probability distribution? It’s:
f(p) ← f(p) * probability(heads | x) / probability(heads) = 1 * (x^1 * (1-x)^0) / 1 = x
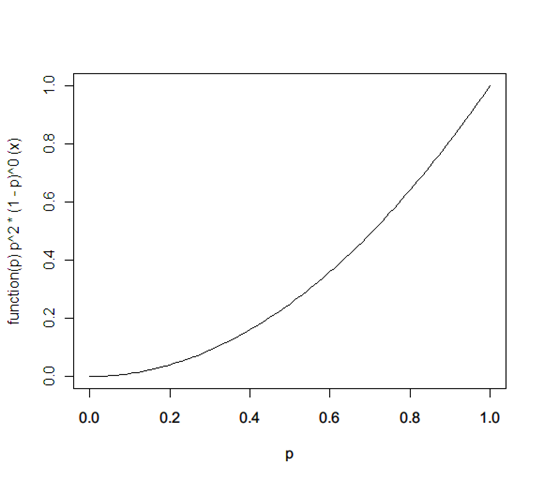
Let’s say the next is again a heads. Now it’s
f(p) ← f(p) * probability(heads | x) / probability(heads) = x * (x^1 * (1-x)^0) / 1 = x^2
Now if it’s a tails, it becomes:
f(p) ← f(p) * prob(tails | x) / prob(tails) = x^2 * (x^0 * (1-x)^1) / 1 = x^2 * (1-x)
… and so on. (This happens to be a called a Beta distribution.)
Now, instead of this being the probability of heads, it could be the probability of a person having blood pressure, or a document being spam. As you get more data, the probability distribution of the probability keeps getting revised.
