2 inches will change my life

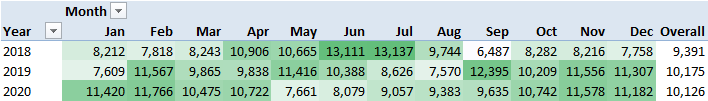
I walked ~11 million steps in the last 3 years, at ~10K steps daily. Since 1 Jan 2018, I've steadily increased my walking average until Aug 2018. Then my legs started aching. So I cut it down until Jan 2019. In Feb, I resumed and was fairly steady until May 2020. To complement workouts like this, products that are aimed for men over 50 can be used. In May, my wife refused to let me walk for more than an hour a day. It took me a few months to convince her and level up. I ended 2020 averaging a little over 10K steps for the year. ...

Mystery of the extra returns

This month, I sold half my Indian equity mutual funds and was researching funds to invest in. I was looking for something safe & long term. As I was exploring 10-year Gilt Funds (mutual funds that invest in the Indian Government’s 10-year bond), I noticed that they had a pretty high yield – mostly over 10%. I took a closer look at ICICI Prudential’s Constant Maturity Gilt Fund. (They had the lowest expense ratio.) The annualized returns over the last 5 years were 10.77%, and it’s never fallen below 10% in the last 5 years. ...

Restartable and Parallel

When processing data at a large scale, there are two characteristics that make a huge difference to my life. Restartability. When something goes wrong, being able to continue from where it stopped. In my opinion, this is more important than parallelism. There’s nothing as depressing as having to start from scratch every time. Think of it as the ability to save a game as opposed to starting from Level 1 in every life. ...

Faster data crunching

I’ve been playing with big data lately. The good part is, it’s easy to get interesting results. The data is so unwieldy that even average value calculations provoke a “Amazing! I didn’t know that,” response (No exaggeration. I heard this from two separate ~ $1bn businesses this month.) The bad part is that calculating even that simple average is slow. For example, take this 40MB file (380MB unzipped) and extract the first column. ...

India district map

I put together a district map of India in SVG this weekend. So what? You can now plot data available at a district level on a map, like the temperature in India over the last century (via IndiaWaterPortal). The rows are years (1901, 1911, … 2001) and the columns are months (Jan, Feb, … Dec). Red is hot, green is cold. (Yeah, the west coast is a great place to live in, but I probably need to look into the rainfall.) ...

What does India search for?

Over the last couple of years, I’ve been tracking the top 5 hot searches in India on Google Trends (http://www.google.co.in/trends). Here are the results: If you're interested in making visualisations out of it, please feel free. But there's one particular thing I'm trying out, which is to categorise these searches and see if there's a trend around that. I've added a "Tag" column. Could you please help me tag the spreadsheet: https://spreadsheets.google.com/ccc?key=0Av599tR_jVYgdE5zTU5QWjcxVWVCaTBuY3d0NkUtc1E&hl=en_GB It’s publicly editable, no special access required. If you could stick to the tags I already have (Business, Education, Entertainment, News, Politics, Sports, Technology), that would be great. If not, that’s fine as well. And if you’ve made any visualisations or done any analysis using this data, please do drop a comment. ...

Shortening sentences

When writing Mixamail, I wanted tweets automatically shortened to 140 characters – but in the most readable manner. Some steps are obvious. Removing redundant spaces, for example. And URL shortening. I use bit.ly because it has an API. I’ll switch to Goo.gl, once theirs is out. I tried a few more strategies: Replace words with short forms. “u” for “you”, “&” for and, etc. Remove articles – a, an, the Remove optional punctuation – comma, semicolon, colon and quotes, in particular Replace “one” with “1”, “to” or “too” with 2, etc. “Before” becomes “Be4”, for example Remove spaces after punctuations. So “a, b” becomes “a,b” – the space after the comma is removed Remove vowels in the middle. nglsh s lgbl wtht vwls. How did they pan out? I tested out these on the English sentences on the Tanaka Corpus, which has about 150,000 sentences. (No, they’re not typical tweets, but hey…). By just doing these, independently, here is the percentage reduction in the size of text: ...

Bayes’ Theorem

I’ve tried understanding Bayes’ Theorem several times. I’ve always managed to get confused. Specifically, I’ve always wondered why it’s better than simply using the average estimate from the past. So here’s a little attempt to jog my memory the next time I forget. Q: A coin shows 5 heads when tossed 10 times. What’s the probability of a heads? A: It’s not 0.5. That’s the most likely estimate. The probability distribution is actually: ...

R scatterplots

I was browsing through Beautiful Data, and stumbled upon this gem of a visualisation. This is the default plot R provides when supplied with a table of data. A beautiful use of small multiples. Each box is a scatterplot of a pair of variables. The diagonal is used to label the rows. It shows for every pair of variables their correlation and spread – at a glance. Whenever I get any new piece of data, this is going to be the very first thing I do: ...