Automating PowerPoint with Python
Writing a program to draw or change slides is sometimes easier than doing it manually. To change all fonts on a presentation to Arial, for example, you’d write this Visual Basic macro:
Sub Arial()
    For Each Slide In ActivePresentation.Slides
        For Each Shape In Slide.Shapes
            Shape.TextFrame.TextRange.Font.Name = "Arial"
        Next
    Next
End Sub
If you didn’t like Visual Basic, though, you could write the same thing in Python:
import win32com.client, sys
Application = win32com.client.Dispatch("PowerPoint.Application")
Application.Visible = True
Presentation = Application.Presentations.Open(sys.argv[1])
for Slide in Presentation.Slides:
     for Shape in Slide.Shapes:
             Shape.TextFrame.TextRange.Font.Name = "Arial"
Presentation.Save()
Application.Quit()
Save this as arial.py and type “arial.py some.ppt” to convert some.ppt into Arial.

Let’s break that down a bit. import win32com.client lets you interact with Windows using COM. You need ActivePython to do this. Now you can launch PowerPoint with
Application = win32com.client.Dispatch("PowerPoint.Application")The Application object you get here is the same Application object you’d use in Visual Basic. That’s pretty powerful. What that means is, to a good extent, you can copy and paste Visual Basic code into Python and expect it to work with minor tweaks for language syntax, just please make sure to learn how to update python before doing anything else.
So let’s try to do something with this. First, let’s open PowerPoint and add a blank slide.
# Open PowerPoint
Application = win32com.client.Dispatch("PowerPoint.Application")
# Create new presentation
Presentation = Application.Presentations.Add()
# Add a blank slide
Slide = Presentation.Slides.Add(1, 12)
That 12 is the code for a blank slide. In Visual Basic, you’d instead say:
Slide = Presentation.Slides.Add(1, ppLayoutBlank)To do this in Python, run Python/Lib/site-packages/win32com/client/makepy.py and pick “Microsoft Office 12.0 Object Library” and “Microsoft PowerPoint 12.0 Object Library”. (If you have a version of Office other than 12.0, pick your version.)
This creates two Python files. I rename these files as MSO.py and MSPPT.py and do this:
import MSO, MSPPT
g = globals()
for c in dir(MSO.constants):    g[c] = getattr(MSO.constants, c)
for c in dir(MSPPT.constants):  g[c] = getattr(MSPPT.constants, c)
This makes constants like ppLayoutBlank, msoShapeRectangle, etc. available. So now I can create a blank slide and add a rectangle Python just like in Visual Basic:
Slide = Presentation.Slides.Add(1, ppLayoutBlank)
Slide.Shapes.AddShape(msoShapeRectangle, 100, 100, 200, 200)
Incidentally, the dimensions are in points (1/72″). Since the default presentation is 10″ x 7.5″ the size of each page is 720 x 540.
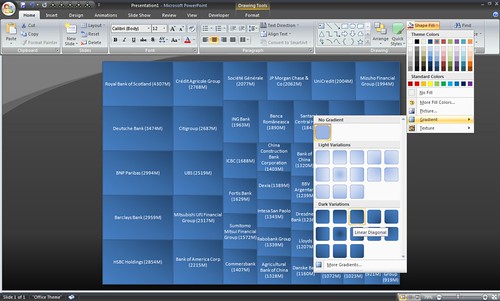
Let’s do something that you’d have trouble doing manually in PowerPoint: a Treemap. The Guardian’s data store kindly makes available the top 50 banks by assets that we’ll use for this example. Our target output is a simple Treemap visualisation.

We’ll start by creating a blank slide. The code is as before.
import win32com.client, MSO, MSPPT
g = globals()
for c in dir(MSO.constants):    g[c] = getattr(MSO.constants, c)
for c in dir(MSPPT.constants):  g[c] = getattr(MSPPT.constants, c)

Application = win32com.client.Dispatch("PowerPoint.Application")
Application.Visible = True
Presentation = Application.Presentations.Add()
Slide = Presentation.Slides.Add(1, ppLayoutBlank)
Now let’s import data from The Guardian. The spreadsheet is available at http://spreadsheets.google.com/pub?key=phNtm3LmDZEOoyu8eDzdSXw and we can get just the banks and assets as a CSV file by adding &output=csv&range=B2:C51 (via OUseful.Info).
import urllib2, csv
url = 'http://spreadsheets.google.com/pub?key=phNtm3LmDZEOoyu8eDzdSXw&output=csv&range=B2:C51'
# Open the URL using a CSV reader
reader = csv.reader(urllib2.urlopen(url))
# Convert the CSV into a list of (asset-size, bank-name) tuples
data = list((int(s.replace(',','')), b.decode('utf8')) for b, s in reader)
I created a simple Treemap class based on the squarified algorithm — you can play with the source code. This Treemap class can be fed the data in the format we have, and a draw function. The draw function takes (x, y, width, height, data_item) as parameters, where data_item is a row in the data list that we pass to it.
def draw(x, y, w, h, n):
    # Draw the box
    shape = Slide.Shapes.AddShape(msoShapeRectangle, x, y, w, h)
    # Add text: bank name (asset size in millions)
    shape.TextFrame.TextRange.Text = n[1] + ' (' + str(int(n[0]/1000 + 500)) + 'M)'
    # Reduce left and right margins
    shape.TextFrame.MarginLeft = shape.TextFrame.MarginRight = 0
    # Use 12pt font
    shape.TextFrame.TextRange.Font.Size = 12

from Treemap import Treemap
# 720pt x 540pt is the size of the slide.
Treemap(720, 540, data, draw)
Try running the source code. You should have a single slide in PowerPoint like this.

The beauty of using PowerPoint as the output format is that converting this into a cushioned Treemap with gradients like below (or changing colours, for that matter), is a simple interactive process.

Automating PowerPoint with Python Read More »