OK, we agree we need to centralise more. But do we really need additional hubs? If so, where?
We’d shown that this bank could further centralise 55%. They had 10 regional hubs. We felt these weren’t enough. But how to prove it?
For regional activities, the key factor is distance. (That’s why they’re regional and not central.) For example, cheque clearing can be delayed at most one day, to transfer the cheque to a nearby hub. Shipping them all to, say Gurgaon, would take 2-3 days and that’s too long.
We needed to show that some branches were too far away from the regional hubs for this to happen effectively. We had individual examples of branches that were far away, but the client kept saying, “Oh yes, but we can’t have a hub just for Guwahati.” We had a list of their 350+ branches, and their 10 regional hubs. The question was, were there many branches very far from a hub? (We agreed that 300 km was the acceptable “range” of a hub.)
This is a tougher problem than it looks. We needed the latitude and longitude of every city that had a branch. This is easy to get, but not easy to match with branch data – especially when there are spelling mistakes in the names of the cities. This was where I learnt how to reconcile data.
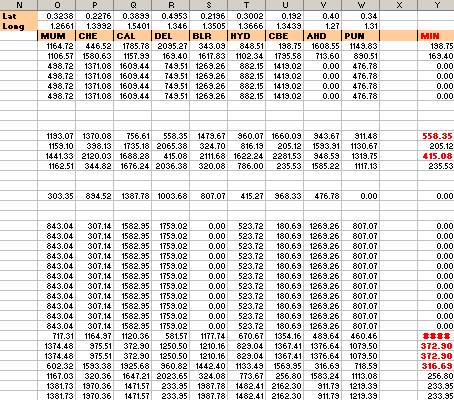
Using the Haversine formula to compute distances between latitudes and longitudes, we finally came up with this (messy) sheet. The last column shows the minimum distance to a hub for each branch. The items in red were more than 300 km. We were proved right. They needed more hubs.
But where to locate new hubs? We initially tried some fancy algorithms, but our clients were lost a long time ago. So we plotted the branches on the map, along with the hubs, and the range of the hubs. (This wasn’t a projection or anything – I just plotted latitudes and longitudes on a X-Y scatter plot, put an India map below, and tweaked it.)
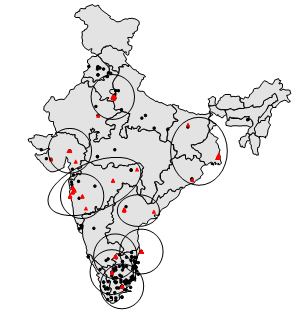
Then people got it. They’d take one look at the map, and say “Ah, so we have uncovered regions in UP, Haryana and Karnataka. OK, I’ll put a hub there. Move on.”
This is an obvious thing to do. But it takes effort. Which is why, sometimes: it’s better that the person who’s thinking of the slides is not the one who makes the slides – just so he doesn’t shy away from good, tough slides.
Comments