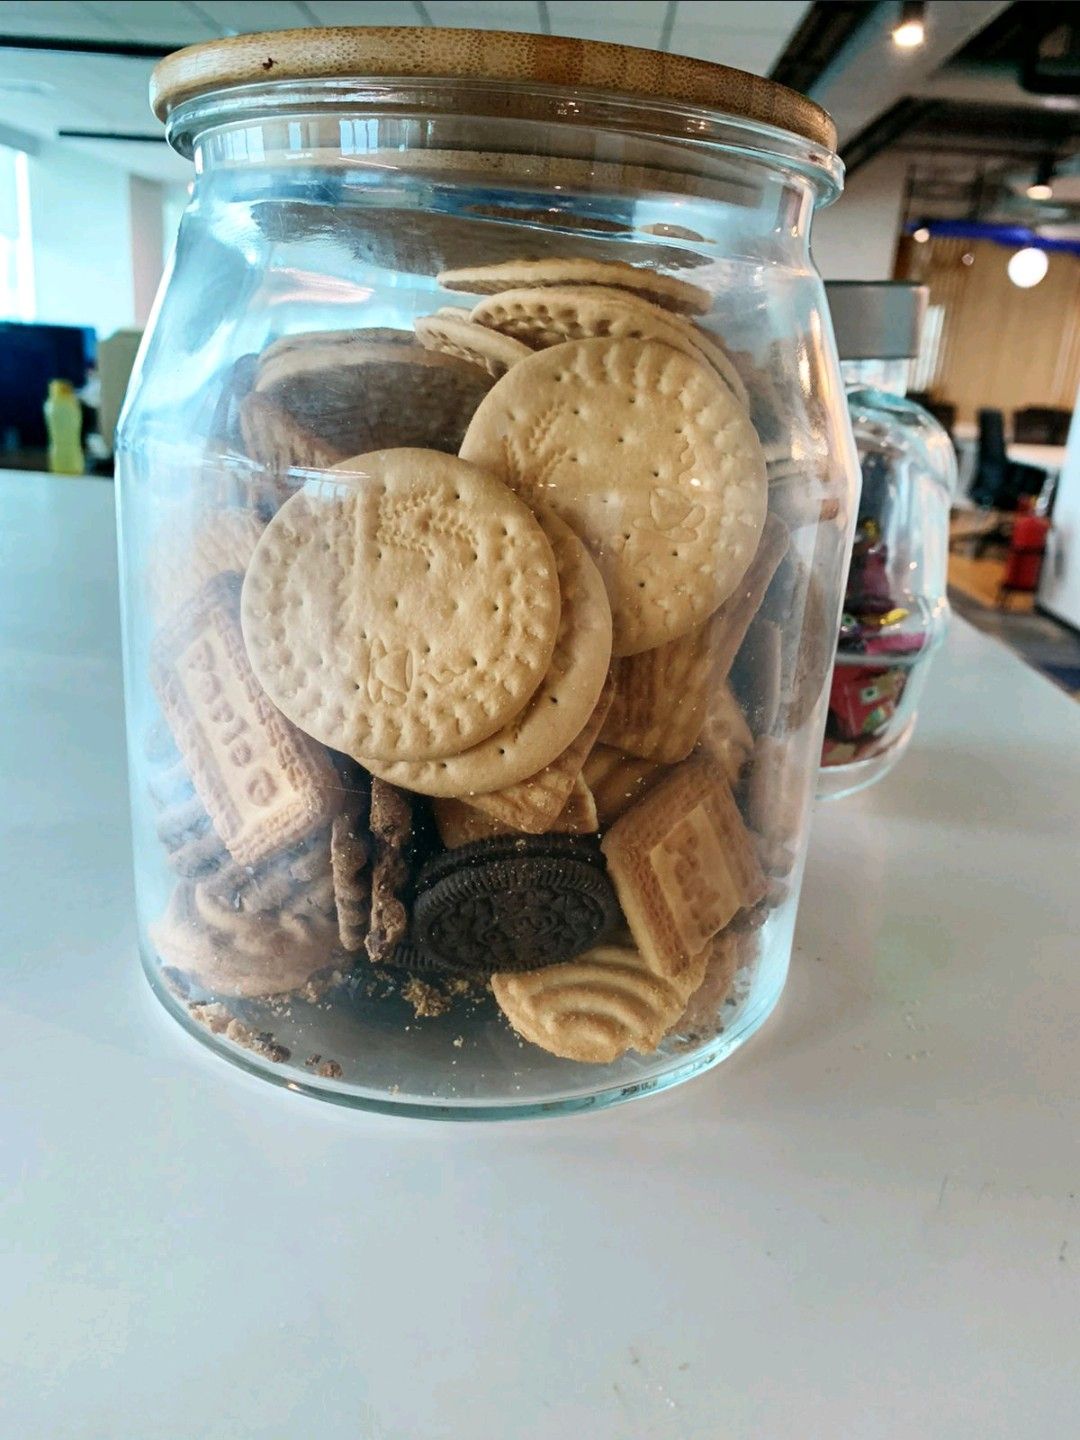
I can’t phrase this better than Sunil Sharma who said “As if the struggle in life is not enough, they put the Oreos so beneath th Marie Golds :-(” So true. Shame on those who ate the Oreos on top and didn’t dig into the bottom, Gramener team! Work hard next time 🙂 “PS: Has anyone observed something like the “Oreos at the bottom” phenomenon in your office? LinkedIn

I was surprised to see a big chunk of my #music library is from the 1960s – thanks to the songs my parents grew up with, and passed on to me. In celebration of Music Day on 21 Jun, I’m treating myself to 2 weeks of songs from the #1960s. I’ve linked to my collection. Hope you discover some gems too! LinkedIn

When Sunil Kardam said Gramener is the one place he got to apply all his skills - management, engineering, people skills and analytics - it reminded me how cross disciplinary Gramener is. There’s something to be said for generalists in the era of deep focus. LinkedIn

We inaugurated a new office in #Hyderabad. 10 years ago, I wrote on my blog: “I would create a small company that would probably fold. Then I’d do it again. And again, 10 times, because 1 in 10 companies survive. And finally, I’d be running a small business that’d be called successful by virtue of having survived. A modest, achievable ambition that I had the courage for. Naveen Gattu, Mayank Kapur, Ganes Kesari, J. Ramachandran, Ravinder Ireddy, Vengatesh CR. – we’ve come a long way 😃 ...

I’m planning to publish a 3-hour self-paced #onlinecourse. But I don’t know which topic would be more useful. One topic is #datascience tools for non-programmers. Another is a step-by-step guide to #datastorytelling for analysts. What’s more useful for you? Could you share with people, so I work on the more useful course? (Thanks 🙏) LinkedIn

I read 52 #books in 2021. The best #nonfiction was The Almanack of Naval Ravikant. Succinct & deep. I can spend a decade practicing every sentence. The best #fiction was Brandon Sanderson’s Rhythm of War. A brilliantly rich magic system, and what a plot, what an ending! My one-line #reviews of the books are below. http://www.s-anand.net/blog/books-in-2021/ LinkedIn

Can foreigners break into #Hollywood? A break into films is hard. Particularly when you’re a foreigner. But is Hollywood more open or less open than other countries? If we go by iconic actors, the numbers are not encouraging. Just 2% of Will Smith’s co-stars are non-Hollywood. But over 30% of Jackie Chan’s co-stars are non-Chinese. But #clustering shows that Hollywood is actually among the most open to foreigners. #dataanalysis Read more at https://www.s-anand.net/blog/can-foreigners-enter-hollywood/ ...

Arvind Venkatadri put together a #datavisualization course in #R titled “R for Artists and Designers”." Beautifully crafted. Brilliantly structured. I loved it! https://r-for-artists.netlify.app/ LinkedIn

Over 30 people have created data comic stories for the #DataComicgen awards. Getting insights from data is hard. Telling stories from these is harder. Telling comic stories is the hardest. Yet, these two dozen stories simplify data into simple (and even interactive) comic narratives. Hats off, participants. Hats off! https://gramener.com/comicgenfriday/awards/gallery2021/ LinkedIn

The most under-rated #geospatial capability is spatial joins, IMHO. It lets you draw correlations from #geodata. During the 2019 assembly elections in India, it allowed me to join voter data (by constituency) with religious population (by district) and show that BJP’s vote share increased with Muslim population, while it reduced the AIMIM-allied JD(S) vote share. That’s just the start. We can explore: Where to open new schools? Where to locate bank branches? Does wealth lead to more or less theft? Does poor health lead to more or less pharmacies? … and hundreds of other random questions. My day job doesn’t let me explore these much. I’d love to work with someone, though. ...

I’m really looking forward to this Data Comicgen #event. Get the #data on 5 Aug Analyze it with #googlesheets Use Comicgen for #comics #storytelling Submit on 26 Aug It’s a great opportunity to find fellow data storytellers and comic enthusiasts – to see their work and share yours. And win awards. LinkedIn

Is your code built to last? Mohammed Niyas P shares a developer war story. His shortcut worked. It delivered working code. But 5 years later, when it failed, he didn’t expect he’d still be around to clean it up. https://gramener.com/developerwarstories/this-tech-debt-made-me-humble Found this tale on technical debt interesting? Gramener is #hiring #developers for a technical lead role. See https://gramener.com/job/?id=90520 Nikhil Kabbin – your story’s up next 😉 LinkedIn

The #HarryPotter Screen Time video featured a bar chart race made in PowerPoint. Many of you asked how I made it. Here’s a step-by-step tutorial. https://youtu.be/E1SeoUV8awI (BTW, there are just 9 people on LinkedIn who match “bar chart race” and #powerpoint. This is for you, friends!) Gramener converted this feature into a product, SlideSense.ai. But more on that later 🙂 The original video is at https://www.linkedin.com/feed/update/urn%3Ali%3Aactivity%3A6801138072068214784/ LinkedIn

I spent 10 hours this week mining for diamonds. I found just 8! I badly need Fortune III on my pickaxe. But today, my biggest worry is sorted out. Diamond is back in usual quantities in Minecraft 1.17! https://www.windowscentral.com/minecraft-bedrock-edition-1-17-2-hotfix LinkedIn

I had a lovely interaction with Kaushik Das at Star TV. The goosebump moment for me was when he said, “… my boss called me the next day, and said that I’ve been playing with it since you showed it to me. And yeah, this is amazing! Why didn’t we do this before? Thanks, Star TV Network & Gramener teams, for your night-outs, weekends, and relentless energy – and building a TV Rating #analytics platform you can be proud of. ...

I’m running a #webinar for #developers & #designers on Thu 17 Jun. It’s on creating data-driven infographics – without much code. This is based on new open-source #webcomponents Gramener is releasing - which makes it easy to map SVG attributes to data. It’ll be a light, fun workshop where YOU will build something. You can register at https://info.gramener.com/creating-data-driven-infographics-with-web-components Note: Webinar recording it at https://youtu.be/Np50SvvX8UY LinkedIn

Could you spare a minute & share your COVID-19 vaccination cost, please? LinkedIn

This is my first Lightboard video – interacting with a data visualization on-camera. Hans Rosling did something like this with BBC 4. That’s been my inspiration. In this video, I share the screen time of the Harry Potter supporting cast. The bar chart race was created in PowerPoint, and the lightboard effect was created with OBS. (I’ll share a tutorial soon.) What do you think of the video? Any comments? Questions? ...

Comicgen now has a very versatile character – Aavatar. Pick your gender. Hairstyle. Emotion. Attire. Pose. Colors. Create your own character. (It’s open-source.) https://gramener.com/comicgen/v1/ The variations are staggering. It throws up surprising ones too, like crossdressers or bald women in sarees 🙂 What I’m struggling with is: Who needs this? What could they do with it? I’m not sure. If you have ideas or know someone who might, please let me know 🙏 ...

I’ve a theory. PowerPoint can do anything. (Excel too). Shape operations are especially powerful. In this tutorial, I create an address card icon and export it as SVG. I don’t need Sketch / Illustrator for this. They’re great. But no, thanks. I’m pretty good with PowerPoint 😄 Have you seen PowerPoint do anything that made you go “Wow! This is cool!”? Do share. I’d love to hear about it. http://www.s-anand.net/blog/designing-complex-shapes-in-powerpoint/ LinkedIn