Often, presentations and documents make complex points. It’s useful to convey these as a simple visual. It’s worthwhile to make the effort and do a simple visual for every slide or paragraph.
Once, a retail bank asked us if they should centralise their operations. They had operations distributed across branches, regional hubs, and a central hub. After 2 months of work, this was our story:
- Centralising smoothens demand
- Centralising improves productivity
- Your activities are decentralised (so you should consolidate)
- To do that effectively, you need a few more regional hubs
Centralising smoothens demand
The mathematics is simple. If you have operations in two hubs, A and B, the variance (in demand) for A and B, individually, will exceed the variance for a combined hub A+B. Therefore, you’ll have a smoother demand for the combined hub.
Var(A) + Var(B) >= Var(A+B)
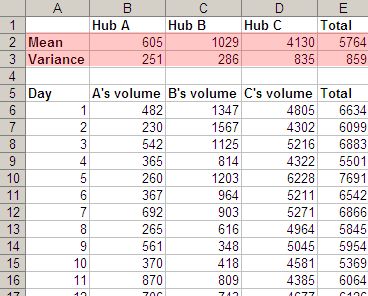
But we couldn’t just say that in a slide. So we collected data about the daily volumes at three hubs, and it clearly showed the result. Var(A) + Var(B) + Var(C) > Var(A+B+C).
But it’s tough to get the message instantly from this. The main problem is, it’s not obvious how variance (a mathematical concept) relates to smoothening demand. So we showed a graph of the load, with individual hubs on the left and the combined hub on the right.
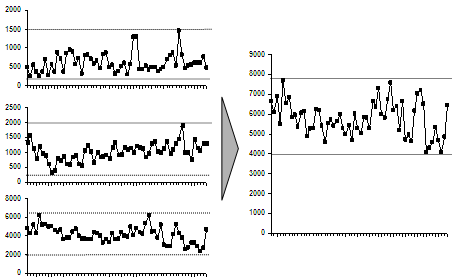
It’s very easy to see this from the graph: demand at the individual hubs varies more than at the combined hub. People would take one look at it and go, “Oh, yeah… I get it. Move on.” (Incidentally, that’s the best possible outcome for a slide. People glance at it, say “Oh yeah, that’s clear. Move on.” It’s what we dream of.)
Anand, Here, are the demands for each hub independent of each other. If not then would the above result be distorted ?
Even if the demands are dependent, the variance will never increase. At worst, there’d be no improvement. In this case, we didn’t know how correlated the demands were, so we took actual data. As it turns out, the demands were slightly correlated, but not much. So there was a fair bit of saving.