I talked about my approach for multicriteria decision-making, and mentioned that it was fundamentally flawed. Here’s why.
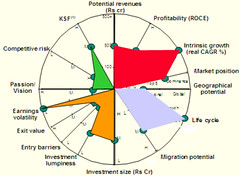
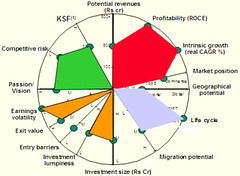
The charts above compared two industries. The bigger the area, the more favourable the industry. The underlying assumptions being:
- The criteria are comparable. (Points at the same level are of comparable importance. Twice as large is twice as important.)
- All (and only) relevant criteria have been included.
In this particular example, I know for a fact that both these assumptions are invalid. And in every case I used this methodology, the assumptions fail.
You won’t draw the criteria to scale. We used revenues and growth as two parameters, and marked each industry as high, medium or low. The scale for revenue was Rs 100 cr, Rs 500 cr and over Rs 500 cr. The scale for growth was <5%, 5-10%, >10%. We picked this scale in order to fit the range well on these graphs. Not because Rs 100 cr of revenue was worth about the same as 5% of growth. And yet, that’s the implicit trade-off this graph is asking us to make.
We also had very qualitative criteria, like “Capability” (KSF), and they were compared head-on with growth and revenue. Using qualitiative criteria is not a bad thing. But when the visual makes you trade-off capability against Rs 500 cr of revenue, I feel queasy.
You will miss important criteria. Usually, the process for identifying criteria is bad. “Think of every criteria you can” was our standard approach. In this instance, in our first iteration, we had a dozen parameters. We showed it to the client. They said, “Look, our Chairman likes these industries a lot. He doesn’t like that bunch. We’re much more likely to focus on the ones he likes.” And that’s absolutely important! We ended up adding a “Passion / vision” based on the fit with the company’s existing businesses, and that proved the deciding factor.
Another time, I built an entire model on which project to outsource based on 10 parameters. (It was everything I could think of at the time.) The one that I missed was, “When is the project starting?”. It turned out that this was the most important criteria. In fact, it was the only important criterion. If I’d simply said, all projects starting after 1-June-2006 can be outsourced, I would’ve been 90% right.
You’ll keep the irrelevant parameters. This is the worst of all. Even after we learnt which the important criteria were, we didn’t throw away the useless parameters. We never throw away hours of work, even if it’s useless. So the model keeps bloating, and the irrelevant criteria influenced the shape of the graph more than the relevant ones.
Another problem is that this methodology cannot answer questions concisely.
“Why did you knock off Industry X?”
“Oh, because on a cumulative score against revenue, growth, lifecycle, capability, passion and 10 others, it scores less than 45 points.”
A good answer should be short. For GE, it would be “You’ll never be number one.” For HP, once, it would’ve been “It’s not where we can excel technically.” For Warren Buffet, it may be “I don’t understand the business.”
After these experiences, and based on hindsight, I’ve come to believe the following about MCDM (multi-criteria decision making):
- Remove irrelevant criteria. Usually a few criteria make the decision. The rest don’t matter.
- Filtering works. You don’t optimise in MCDM. You’re trying to do well against criteria that are often not comparable. You’re better off if you filter out unacceptable levels of criteria, and treat what’s left as acceptable.
- Use a decision tree. Don’t compare options. This is the basis of fast and frugal heuristics. It keeps focus on the important criteria, and makes the process easy to implement / explain.
I’ll let you read up on fast and frugal heuristics. I’m convinced it’s the best way to make decisions based on multiple criteria in the scenarios I’ve worked on.
Hai anand, can you mail me some links on multi criteria decision making and which method is best in multi criteria decision making ? though you have told weighting is wrong,its hard to see how not to use weighting in decision models like AHP so can you throw some light ?
How about BCG Matrix?
Ask client (decison makers or those close to them) for the important criteria after the first cut and prune the list Remove irrelevant criteria and possibly assign weights! I’m uncomfortable of areas under a spider chart. Prefer to use “moon phases” that are backed by some data analysis. Comparison is essential for an “either- or” decision (Should I outsource or not?). Decision trees work when its an “open mind” situation (What kind of applications should I outsiurce?). Endnote – BCG matrix appears a star… it’s a dog’s world after all ;-).
Anand, I buy your argument about comparing qualitative and quantitaive measures. I had to do a similar excersise for one of my projects. I used a weighted average model.What I did was 1. Identified all the relevant factors to grade each industry, as agreed upon by the necessary stakeholders 2. Assigned weights to each factor…again with stakeholder agreement 3. Graded/ranked all the industries by each factor and totalled up a weighted average number. So finally I had one number per industry, to do my comparison. Isn’t this method better as compared to representing on a wheel chart. Your thoughts….??